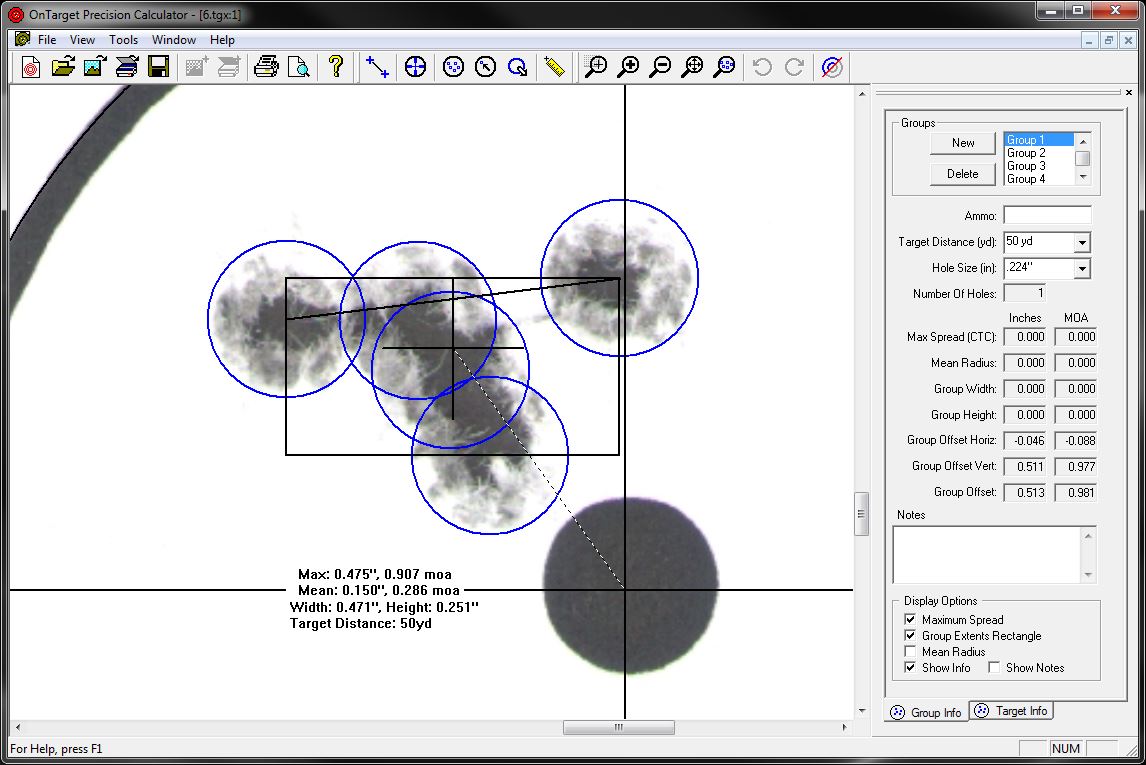
Hey, without restarting a discussion of Hornady podcast 50 (Which is happening elsewhere), is anybody aware of a software program that will measure your mean distance from the shots to the POA? That would be a measure of BOTH group size and POA-POI difference. I think I'm going to start measuring that.
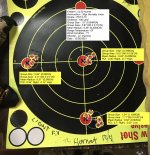
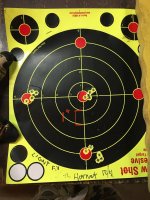
The other way to do it, which I may do instead, is to use targets with dots and just shoot a row of dots, kinda like we did about 7 years ago on the SH challenge. I think that would make it easier to measure a "group" of any size. May even be a way to print the dots onto some kind of graph paper to facilitate measurement.
Ideas and thoughts appreciated. Thanks! SOA
ETA: another thing that the math/stats-minded guys might want to do (I'm thinking about it myself), is make a multivariable model that integrates the mean POA-POI difference I'm talking about and uses a multivariable model that also includes SD and is integrated with a ballistics calculator and tells you your predicted hit rate (kinds like a Litz WEZ analysis) at a given distance. Which is really what I want when I'm doing load development for long/extreme range shooting. Group size is for BR shooters.
Last edited: