• Watch Out for Scammers!

    We've now added a color code for all accounts. Orange accounts are new members, Blue are full members, and Green are Supporters. If you get a message about a sale from an orange account, make sure you pay attention before sending any money!

Ballistics Tables

  • Thread starter Deleted member 113831
  • Start date
D

Deleted member 113831

Guest
I may be the only one on here who actually wants this, but here goes:

There have been several threads and mentioned instances on this forum concerning either phones that have gotten destroyed, or lost, or just outdated. These phones contained much valuable ballistic data that must be either redone, or recovered (hopefully) from whatever device it was on.

Now, this is a great argument for keeping all your hard earned and expensively validated data on a hard copy such as in a dope book...I'm totally on board with that and have been a proponent of that for as long as I have been shooting. However, I would like something even more than that.

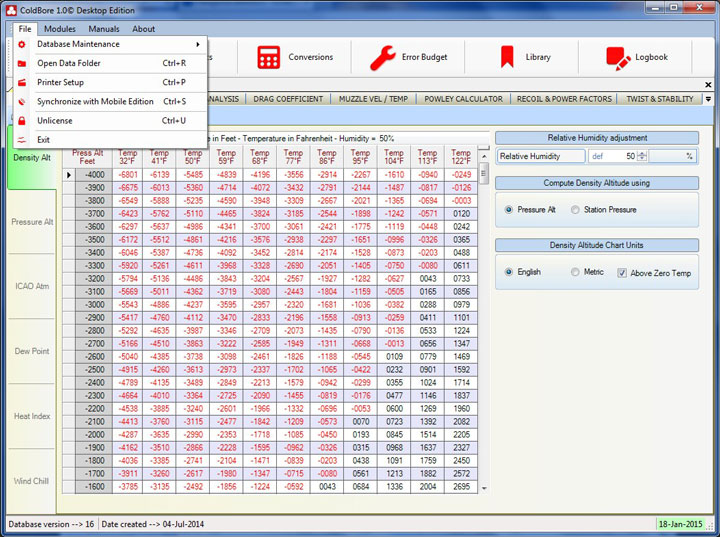
I would like a modern set of ballistics tables ranging from about .400 G1 BC to .800 G1 BC, covering altitudes from sea level to 10,000 ft elevation. I would like them to cover temp ranges from 0*F to 120*F. Another alternative would to somehow alter or divide up Marc Taylor's (@Enough Said) Weaponized Math charts by tailoring them more specifically for particular BC ranges and altitudes.

There would be an accompanying comprehensive list of longrange bullets in the index with their associated G1/G7 BC's. There could even be pictures of the bullets, so that if you had an unknown bullet...you could go to the table and find the diameter, the weight, and measure the length of ogive and boattail and at least get and idea of about what kind of BC you are dealing with (manner a la Litz).

The idea is that without electronics, I could reference the index for my bullet BC, then choose the speed and altitude I will be shooting at and get a complete set of "try dope" out to at least 1k yards. Even if we lose our dope, most of us remember our BC, our speed, and at least one of our drops at distance. Matching up those points with a predictive printed chart would fill in the blanks we don't remember, making it easy to "back into" the work recovering what we have already done.

There have always been some of the loading manuals that had some very basic ballistics tables in the back. But, they usually only went to 500 yards, and they typically list the drop in inches rather than angular measures.

I know that everyone is into their electronics, I know that this will not be as accurate as predictive software...I get it. I do wonder if the time is coming when these types of programs will be illegal and banned. Then what?

I'm probably gonna get hammered for posting this, but what says The Hide? Flame On!
 
Last edited by a moderator:
The Whiz Wheel is an excellent piece of equipment.

Have you tried JBM Ballistic and printed out your charts?
 
I too like non battery powered charting. My favorite piece of kit is my FDAC. I may have to order a whiz wheel one of these days to try out. My first impression is a lot is going on. I resort to making my own DA charts for anything other than 175smk. I end up always reinventing them though to keep them as intuitive and user friendly as possible. They can take forever building when trying to migrate in data from my AB app (which i love). I just like having all my information on a chart so i dont have to hunt and peck around an app. Love excel to make the charts because you can customize pages exactly how you want them to look and operate. I wish there was an AB version of Excel🤣
 
Have you looked at the Accuracy First Whiz Wheel. Probably one of the most comprehensive and accurate backup systems around. You can have multiple inserts for multiple bullets, and it uses our Applied Ballistics Laboratory Radar Data instead of G1 or G7 BCs.

Two things against the Whiz Wheel...

First, Todd Hodnett can eat a dick....
Second, the wheels are load specific, cost $20 a piece, and I think I would go cross-eyed by the time I figured all that fuckery out.

Looking for a more generalized solution. If Todd's answer was a reallly, realy good one, I'd consider it...but it ain't.
 
Have you tried JBM Ballistic and printed out your charts?
That is what I have considered.

I have printed out quite a few using the range card function, but wishing for something a bit more complete and ready to print into book form. Thinking of something worthy of Reference book status. Something that would be a "must have" for anyone who wants a comprehensive collection.

Something worthy of sitting next to books by P.O. Ackley, Phil Sharp, Bryan Litz, Pesja, McCoy and Galli (@lowlight)...etc.
 
Last edited by a moderator:
  • Like
Reactions: Leatherlunger
I use CB and export the data into my own created Excel spreadsheets which I can print and then laminate. I use them along with the Weaponized math sheets that are also laminated. I use carabiners to keep the laminated charts together and they are in my range box.

It is a LOT of work depending on how much data you want. One cartridge can take up to 10 4x6 inch cards to properly document all the variables of range, DA, etc. I figure it takes me up to 8 hours to do one cartridge. I have two 6.5 Creedmoor cartridges, one 7.62x51 cartridge and two 338 LM cartridges documented. The time does not include the time required to redo them when you finally true the cartridge.

It works well for me as I never have to worry about not having a foolproof backup to the instruments
 
Weaponized Math doesn't care about your B.C., D.A. or any other input. Just shoot it. If done correctly by a fundamental shooter, one can march from 300 to 1,000 in 8 rounds with your firearm and unfamiliar ammo. Leave the solver in the truck until you've firmed up your actual data, then make the solver solution match the real world solution using the inputs.
 
Weaponized Math doesn't care about your B.C., D.A. or any other input. Just shoot it. If done correctly by a fundamental shooter, one can march from 300 to 1,000 in 8 rounds with your firearm and unfamiliar ammo. Leave the solver in the truck until you've firmed up your actual data, then make the solver solution match the real world solution using the inputs.
What if time and/or space do not permit shooting every even yardline from 100 to 1k?

How does weaponized math in it's current form help that person?
 
Weaponized Math benefits a shooter. It is not reference material, it is a tool to create reference material.

Train at a Sniper's Hide Training Course and it will all come clear to you.
 
A long 2 cents post (thread killers)

The idea has merrit. Finding the right purpose and place to use the information is the key.

Reference options
Having SO many options for each bullet becomes very daunting
  1. BC (0.4-->0.8) By 0.01?
    1. Velocity (2700-->3200?) by 50fps?
      1. Temperature (0-->120)
      2. Elevation (0-->10000
You could combine the environmental parts into DA to simplify things and use the standard pressure and temperature for each 1000 feet. from -1000 to 12,000. This would eliminate one variable.

BC - 40 options
Velocity - 10 options
DA - 13 options
This comes to 5200 ballistic try dopes If you makes each DA table one table its 400 tables. If you go with the temperature and elevation separately we're looking at 48,000 trys and 4,800 elevation tables.

Is it feasible? sure. Is it Useful? That's the question.

If the purpose of this reference is to be able to loose your phone, go look up your bullet info and table and have your data back, I don't think the idea works. IF the purpose if to look up your bullet and table and have a really close (try-dope) to some what rebuild your program until you can verify and true it again, then it might have merit.

We know one rifle does not shoot the same as the next rifle. So even if we look up the BC and velocity how confident are we that the try dope will really work? Its still a guessing game. For comparing one bullet to another or caliber to another I can see it useful but for application in the field I don't know if it will catch on.
Example:
In the book is a table for 6.5mm 130ELD going 2900 fps at 60 degrees and 2000ft elevation is that going to work for every rifle? or even my rifle? Maybe the data in the 90 degree table works for my rifle on a 60 degree day. Its just that way.

The extra variable that we cannot account for a the shooter and rifle. When we put these in the mix I think a book of data charts becomes a miss-placed reference because none of the information can be valid in the field. There is a reason most programs have a truing system. DSF or scale factor or require manual truing. These are variable we cannot define. I am sure @DocUSMCRetired could find examples of the same bullets shot in the same conditions, at the same velocity that has different 1000yd drops. The shooter and the rifle will be the mathematical errors that result in different drops and we cannot calculate this error. Example - My neighbor's daughter and I have 0.4mil different 1000 yard dopes on my rifle.

From a Try-dope Perspective:
Marc's weaponized math has been an amazing tool. It really works and I think there might be a way to use that rather than all the bullet options. The current weapoized math works starting from 300yds and working your way out, maybe we could re-arrange it to work from 1000yd back in to 300. All you world have to memorize is your 1000yd dope. Then create a graph for the BC and velocity to find out what columns on the weaponized math you should use. We could effectively break this down to 2 to 5 sheets and have the same data for field use.

The issue with memorizing your 1000yd dope is you need to have a reference of pressure and temperate with it. Most references stop at 500 yards because this is where temp and pressure to start to effect the bullet trajectory. Even so, if you were off a a tenth or two would not be the end of the world. At least you would have very close data.

I might put this together later this week or next to show you want I am thinking and we can discuss it more.
 
  • Like
Reactions: Leatherlunger
Ted's charts are pretty good that the end-user can fill in with their kit. I like his Temp models too

Like these I think are great,

tikka-6-5-creed-hl-130eld-2019-10-17-density-altitude-1-jpg.7221662


As a side note, Coldbore 2.0 on the Desktop makes great track specific charts,
ColdBore1_Main.jpg
 
A long 2 cents post (thread killers)

The idea has merrit. Finding the right purpose and place to use the information is the key.

Reference options
Having SO many options for each bullet becomes very daunting
  1. BC (0.4-->0.8) By 0.01?
    1. Velocity (2700-->3200?) by 50fps?
      1. Temperature (0-->120)
      2. Elevation (0-->10000
You could combine the environmental parts into DA to simplify things and use the standard pressure and temperature for each 1000 feet. from -1000 to 12,000. This would eliminate one variable.

BC - 40 options
Velocity - 10 options
DA - 13 options
This comes to 5200 ballistic try dopes If you makes each DA table one table its 400 tables. If you go with the temperature and elevation separately we're looking at 48,000 trys and 4,800 elevation tables.

Is it feasible? sure. Is it Useful? That's the question.

I was thinking of eliminating temp and just going with velocity and station pressure. Temp on it's own has the greatest impact on muzzle velocity, which would be addressed by referencing the appropriate speed increase due to changes in powder burn rate.

I was thinking every 1,000 ft (01.00 inHg of station pressure), and probably BC points in 0.020 G1 increments.

If DA was used, that would be fine as well, just include a DA chart to reference as well.


If the purpose of this reference is to be able to loose your phone, go look up your bullet info and table and have your data back, I don't think the idea works. IF the purpose if to look up your bullet and table and have a really close (try-dope) to some what rebuild your program until you can verify and true it again, then it might have merit.

This ^^^ ...not to be perfect, but to be within maybe 0.2mil of your actual dope. Or, to get you by in an emergency for say an upcoming hunt, or maybe you are assisting a friend who is clueless and calling you on the phone asking for help.

We know one rifle does not shoot the same as the next rifle. So even if we look up the BC and velocity how confident are we that the try dope will really work? Its still a guessing game. For comparing one bullet to another or caliber to another I can see it useful but for application in the field I don't know if it will catch on.
Example:
In the book is a table for 6.5mm 130ELD going 2900 fps at 60 degrees and 2000ft elevation is that going to work for every rifle? or even my rifle? Maybe the data in the 90 degree table works for my rifle on a 60 degree day. Its just that way.

The extra variable that we cannot account for a the shooter and rifle. When we put these in the mix I think a book of data charts becomes a miss-placed reference because none of the information can be valid in the field. There is a reason most programs have a truing system. DSF or scale factor or require manual truing. These are variable we cannot define. I am sure @DocUSMCRetired could find examples of the same bullets shot in the same conditions, at the same velocity that has different 1000yd drops. The shooter and the rifle will be the mathematical errors that result in different drops and we cannot calculate this error. Example - My neighbor's daughter and I have 0.4mil different 1000 yard dopes on my rifle.

I expect that her initial zero would be different as well, which may account for a lot of that difference. But, maybe not.

From a Try-dope Perspective:

Marc's weaponized math has been an amazing tool. It really works and I think there might be a way to use that rather than all the bullet options. The current weapoized math works starting from 300yds and working your way out, maybe we could re-arrange it to work from 1000yd back in to 300. All you world have to memorize is your 1000yd dope. Then create a graph for the BC and velocity to find out what columns on the weaponized math you should use. We could effectively break this down to 2 to 5 sheets and have the same data for field use.

It is an amazing tool, I was thinking of just adjusting the tables for altitude and maybe some gross BC categories (maybe 50 or 100 G1 BC differences) to narrow down the range. Also, some cross referencing. So if I have a 300 and an 800 data point for my actual gun, the math could be easily done to back into the rest.

The issue with memorizing your 1000yd dope is you need to have a reference of pressure and temperate with it. Most references stop at 500 yards because this is where temp and pressure to start to effect the bullet trajectory. Even so, if you were off a a tenth or two would not be the end of the world. At least you would have very close data.

I might put this together later this week or next to show you want I am thinking and we can discuss it more.
I annotated my response in blue in the quote above, thank you for your input.
 
Oh, and PS, I have the number to do weaponized math at 200 yards, it's x1.95

Might be worth to start over at 200 and just add that in I believe the space is there
Didn't you have to fudge the X-factors to get them to line up at your range? I seem to remember you saying that in a podcast while doping out the 224 Valkyre.
 
@lowlight, @Enough Said

I appreciate all you guys have done. Maybe I haven't made my intentions clear. I want to take the direction you guys are going with hard data, and take it to it's logical end.

I don't want to have to use computers at all. I want to use the knowledge gained and disseminated from the last 10 years of ballistic forecasting and wring every bit of precision and calculation out of them right now, and put it in permanent form.

One reason we know so much about the Civil War, is because there are a ton of pictures that still exist. We can literally read documents that are 2,000 years old! Contrast that with the data that has been lost over the years due to changes in platforms or computer crashes. Think about all the music that got lost going from 78rpm records to 33rpm LP's to 8 track and cassette and then CD...etc.

The only way to ensure that this knowledge stays around and is accessible and understandable forever, (well, as long as paper lasts) is to print it.
 
  • Like
Reactions: Leatherlunger
Good luck.

You're asking for ballistic firing table books like the Army produced for artillery, rockets, and mortars based around a number of projos and charges from fixed propellant bags and fractional charges. Those were the equivalent of medium-sized paperback books for known rounds (usually HE, illumination, and smoke) and fixed barrel lengths. With the variety of bullets and powders available today, your starting basket (digital calculation and variable storage for different weights and brands of bullets) is much broader, not even counting for temperature, density altitude, and other meteorological data.

1603906762272.png
1603906808500.png


The tables for a 16-inch 7.62 10-twist auto-loader would be pretty detailed even if you're only talking about three bullets (for example 155, 168, and 175 Match Kings) and two powders (4064 and Varget).

I guess if you were ambitious and patient (or have enough calculating power and the resources to shoot and verify the data) I might buy one of your books. If they're accurate I'll buy for a bunch of rifles and calibers (at least 5.56, 7.62, and 338 Lapua).
 
Last edited:
  • Like
Reactions: Leatherlunger
So here is a start for the table. (work sucked today so I started this)
This is the weapoized math but working backwards. I'm calling it weaponized Data. I gave every possible option at 1000yds (increasing by 0.1mils) and reversed the percentages. From this table you should be able to pick out your 1000yd data and have a ballistic table that is within 3 tenths of what your rifle really is. Using your 600yd data might work out with less error. I was getting a 1-2 tenth error on all my rifles.

The intermediate ranges (25, 50, 75) of each yardage is taken by the straight % of change in that 100 yards. Not perfect but it would get the job done.

1603922880879.png


The final link to this will be creating a graph or chart that correlates BC and Velocity to a 600yd Drop Value. This would let people pick thier BC and velocity to get a starting point if they needed it.

Try your data and see what you get. Does this work for your rifles? If you have one drop point your should be able to get close with this.
 
Good luck.

You're asking for ballistic firing table books like the Army produced for artillery, rockets, and mortars based around a number of projos and charges from fixed propellant bags and fractional charges. Those were the equivalent of medium-sized paperback books for known rounds (usually HE, illumination, and smoke) and fixed barrel lengths. With the variety of bullets and powders available today, your starting basket (digital calculation and variable storage for different weights and brands of bullets) is much broader, not even counting for temperature, density altitude, and other meteorological data.

View attachment 7456661 View attachment 7456663

The tables for a 16-inch 7.62 10-twist auto-loader would be pretty detailed even if you're only talking about three bullets (for example 155, 168, and 175 Match Kings) and two powders (4064 and Varget).

I guess if you were ambitious and patient (or have enough calculating power and the resources to shoot and verify the data) I might buy one of your books. If they're accurate I'll buy for a bunch of rifles and calibers (at least 5.56, 7.62, and 338 Lapua).
Those tables go much further than 1k yards and every single yard line could result in a miss if not calculated exactly. High angle fire is very different than direct fire.

Long range rifle rounds with similar velocities, can have very dissimilar BC's... and yet, still have very similar drops to 500 yards. Considering that fact... the charts could be even more generalized from 100 - 500 yards which would eliminate much of the repetition.
 
So here is a start for the table. (work sucked today so I started this)
This is the weapoized math but working backwards. I'm calling it weaponized Data. I gave every possible option at 1000yds (increasing by 0.1mils) and reversed the percentages. From this table you should be able to pick out your 1000yd data and have a ballistic table that is within 3 tenths of what your rifle really is. Using your 600yd data might work out with less error. I was getting a 1-2 tenth error on all my rifles.

The intermediate ranges (25, 50, 75) of each yardage is taken by the straight % of change in that 100 yards. Not perfect but it would get the job done.

View attachment 7456853

The final link to this will be creating a graph or chart that correlates BC and Velocity to a 600yd Drop Value. This would let people pick thier BC and velocity to get a starting point if they needed it.

Try your data and see what you get. Does this work for your rifles? If you have one drop point your should be able to get close with this.
That is really good. I'm guessing you did that for sea level using the original X-factors. The first column matches very close to my 300 Win. My 308 is too slow to be on that chart.

If the X-factors are adjusted slightly for altitude, then it could work even better.
 
So @Skookum, a couple of questions
  1. Is this possible to do? I have often wondered if all I had was my 200 yard DOPE, could I use this as you show and take a shot at 800 yards simply by using a multiplicative factor that was the product of all the ranges before. Looks like it would be close
  2. How are you developing the factors at different station pressures? Is there a formula for that?
In this case, I have accumulated notes from my 308 Win that I have used as a basis of verification for Strelok (Except 22.0 inHg, I have never shot at that high an altitude, that is all Strelok).

I simply used my cartridge as a representative example of a .500 G1 BC bullet @ 2600 fps. The 2600 fps speed isn't exactly my speed (2630fps at 60*F), but close enough to compare drops for verification.

I came up with the X-factors the same way that I presume Marc did. I just used the trajectory itself and did the division.

I have plenty of data for 300 Winmag, I plan to do a table for it as well. Then I'll start playing around with trajectories and speeds in the middle to see if they are predictable.

Any bullet with a similar BC, at a similar speed, at a similar altitude should have a similar trajectory.
 
  • Like
Reactions: Nik H
Well. I finally got this little exercise wrapped up.
After several weeks of thinking about how to get this job done here is the simplified version of it. I went to the Hornady calculator online and just started recording the data into a spread sheet. Afterward I played with the variables. I found a few really interesting things.

  1. The Hornady online calculator does not take into consideration your bullet weight for drop data. A 15gr and 200gr bullet will return the same drop information.
  2. Changing pressure by 2inhg or temperature by 30deg F or Elevation by 2000ft equated to changing your BC by 0.05. This eliminates the need for multiple charts for multiple elevations or temperatures. You just need to apply the correction factor for your location or condition.
  3. I calculated the x-factor for the weaponized math from these charts and used them in the weaponized drop data tables below. These values are a little different than what @Enough Said calculated. You will see these are different than the table I posted above. Mine (these) are theoretical values and Taylor's (above) are real world values. I felt it was necessary to make the velocity tables and the weaponized drop data tables match for this exercise. You'll find the 0.55 and 0.6 BC drop values from the velocity tables match the weaponized tables very nicely. Then as you move further away from them you will have more error in the weaponized table due to the x-factors changing. Marc and Frank a ways said you have to tweak them to fit your conditions and I can see that now. after this evaluation It is very obvious the x factor is based on BC and not the velocity. Most if the velocities averaged the same x-factors for the each BC column. (more data in the background of this than shown here.) I listed the X-factors used at the top if the weapoized data tables if you are curious were they averaged out.
Moving forward these could be broken into more refined velocities and tables added, but this is just a start for now. Raw data from a calculator in raw format.

Here are the tables:
Velocity by 100fps changes
BC by 0.05 changes
Basic Ballistic Tables 2 Page 001.jpg


Basic Ballistic Tables 1 Page 002.jpg


I still think there is graph that will make this work, I just haven't found it yet.
Enjoy.
 

Attachments

  • Basic Ballistic Tables 2.pdf
    159.1 KB · Views: 199
  • Love
Reactions: smoooth1
Sorry I am not caught up on what is going on here,

I have to head out in about 15 but before I go and come back to read this thread, as it appears to have more and new valid data that replaces the computer.

@Skookum

The weaponized math numbers I tweaked on my range were minor, just 800, 900, 1000, I moved the number from 1.24 to like 1.20 for the higher elevation. Remember my average DA is about 7000ft vs AK which can be 1000ft or less.
Thank for responding Frank,

I realize the tweaks are small. I really wasn't trying to upset any apple carts, just take a good idea and refine it a bit and maybe find a different way of using it and to make it more flexible.

My idea was to have the X-factors adjusted for different bands. There would be a BC band, a velocity band, and an inHG band.

What @Jack Master has done is combine those in a different more compact way that seems to make it simpler yet. These charts basically take the place of an entire book of redundant ballistics tables.
 
5325C623-1612-4035-AB94-7614413E44DD.jpeg


AF4F5973-10E8-4F82-B7B6-C3882EC67EEA.jpeg


If you’re serious about it, this is how it was done back in the day, just for a different work set.

Model your charts after these.

Not sure if this was posted earlier.
 
Actually - thinking about it - all you’ll need to do is ROUGHLY define an Equation of State, then carry a Logarithm Pocketbook with you.
 
  • Like
Reactions: LastShot300
Well. I finally got this little exercise wrapped up.
After several weeks of thinking about how to get this job done here is the simplified version of it. I went to the Hornady calculator online and just started recording the data into a spread sheet. Afterward I played with the variables. I found a few really interesting things.

  1. The Hornady online calculator does not take into consideration your bullet weight for drop data. A 15gr and 200gr bullet will return the same drop information.
  2. Changing pressure by 2inhg or temperature by 30deg F or Elevation by 2000ft equated to changing your BC by 0.05. This eliminates the need for multiple charts for multiple elevations or temperatures. You just need to apply the correction factor for your location or condition.
  3. I calculated the x-factor for the weaponized math from these charts and used them in the weaponized drop data tables below. These values are a little different than what @Enough Said calculated. You will see these are different than the table I posted above. Mine (these) are theoretical values and Taylor's (above) are real world values. I felt it was necessary to make the velocity tables and the weaponized drop data tables match for this exercise. You'll find the 0.55 and 0.6 BC drop values from the velocity tables match the weaponized tables very nicely. Then as you move further away from them you will have more error in the weaponized table due to the x-factors changing. Marc and Frank a ways said you have to tweak them to fit your conditions and I can see that now. after this evaluation It is very obvious the x factor is based on BC and not the velocity. Most if the velocities averaged the same x-factors for the each BC column. (more data in the background of this than shown here.) I listed the X-factors used at the top if the weapoized data tables if you are curious were they averaged out.
Moving forward these could be broken into more refined velocities and tables added, but this is just a start for now. Raw data from a calculator in raw format.

Here are the tables:
Velocity by 100fps changes
BC by 0.05 changes
View attachment 7474223

View attachment 7474192

I still think there is graph that will make this work, I just haven't found it yet.
Enjoy.
Thanks I downloaded this.
 
BC is how they give the value to the shape, area, mass of the bullet, then the velocity on which it’s pushed, the rate of drop is the BC, so it makes sense, talking gravity

I just did a video today with some new gear and I did a weaponized math video and hit center line, but for sake of time and the day, I went to 600, on my range I need to tweak the 800, and 900 to 1000. If I recall I made both, 1.2
 
I've been having a guy in Ca make custom databook pages for me but sounds like he's not really doing it anymore.:cry: