• Watch Out for Scammers!

    We've now added a color code for all accounts. Orange accounts are new members, Blue are full members, and Green are Supporters. If you get a message about a sale from an orange account, make sure you pay attention before sending any money!

ChronoPlotter: A new open source tool for graphing chronograph data

mc10

Private
Minuteman
Feb 27, 2021
38
125
Boston
chronoplotter.com
Hi everyone, new to the forum. I recently released a software tool I wrote to easily generate charge weight vs. velocity graphs without any manual data entry necessary. It currently supports LabRadar and MagnetoSpeed with SD card.

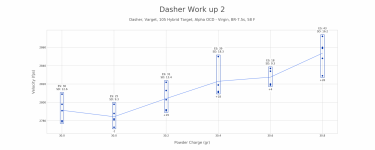
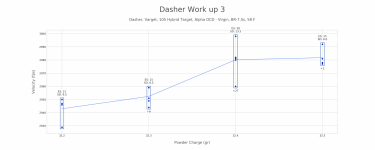
Full instructions are here, but basically point ChronoPlotter at your SD card or any directory with series data, auto-fill in the charge weights (if they're at constant intervals), then click Show graph and that's it. No manually typing in velocities, no screwing around in Excel.

scatter.png


These chronos store velocity data in CSV format, but the task of actually extracting and using that data from the SD card can be tedious. Some folks report handwriting their chrono data in a notebook to avoid it altogether. After experiencing this with my own LabRadar, I wrote ChronoPlotter to solve it.

ChronoPlotter is open source which means anyone's free to use it and look at how it works. The project is written in Python, but if you don't have Python installed you can instead simply download the prebuilt program for your OS:
Please note it will take a few moments for the program to start. Details here for those who are curious why.

The program also supports creating line chart + SD bar-style graphs, and has other features like handling round-robin (OCW) data where each chrono series contains one shot from every charge weight. You can also configure the graph in a number of ways, like annotating each series with its stats.

You can view the project in its entirety here: https://github.com/mncoppola/ChronoPlotter

Please let me know if you have any feedback, feature requests, or bug reports. Thanks!
 
Wow! This seems like an awesome tool. I shall try it out. Thank you for your time and effort that went into this.
 
  • Like
Reactions: mc10
Nice work! Maybe you can add a ladder graph too. A single series that is a ladder of different powder weights to check velocity and pressure.
Now I wish I had written down all the series of my magnetospeed so I can chart them all.
 
  • Like
Reactions: Holliday
Nice work! Maybe you can add a ladder graph too. A single series that is a ladder of different powder weights to check velocity and pressure.
Now I wish I had written down all the series of my magnetospeed so I can chart them all.
Thanks! Single-series ladder graphs should actually be supported already. If you have a single series enabled containing X shots, the Convert from round-robin button will split it into X series of one shot which you can then graph.
 
Just tried it. Only had two strings of 6 on my magnetospeed card but it looks great. One thing that stumped me for a minute was when I chose the directory, I could not see the .csv file, so I thought I was doing something wrong. Finally kept going and it loaded automatically.

I can see this will be a great time saver. I just need to remember to start a new series for each load increment on the range.
The initial version only supported LabRadar, which splits its series across individual directories so showing only directories made sense back then. Now that MagnetoSpeed is supported there's definitely room for improving the UI there, good feedback
 
  • Like
Reactions: Holliday
This is awesome! Thanks for creating this and also making it open source! Excited to try it out, I just got my MagnetoSpeed recently, so this will save time trying to build my own system.
 
  • Like
Reactions: mc10
The initial version only supported LabRadar, which splits its series across individual directories so showing only directories made sense back then. Now that MagnetoSpeed is supported there's definitely room for improving the UI there, good feedback
I look forward to seeing any improvements. Really appreciate folks taking the time to do things like this for us shooters.
 
  • Like
Reactions: mc10
As a new guy to precision shooting and reloading, I look forward to trying out the tool to help manage data. Thank you for putting in the work and making this available!
 
  • Like
Reactions: mc10
So looking at the destructions, how does it treat a single series (Magnetospeed) of 20 shots with different charge weights?
think: Satterlee style velocity test of 10, 15 or 20 rds.
(versus what looks like, it wants to translate each charge weight is a new series?)
Am I reading this correctly?

Or, asked another way: When chronoing data, do you want to start each charge weight as a new series, or will it grab those 20 shots and spit them out in the graph with the charge weights as one series?
ChronoPlotter expects each charge weight to be its own series (by default it'll display those 20 shots as a single series on the graph), but there's a feature to handle that case. If you have only that single series enabled (the only series checked in the list), click the Convert from round-robin button and it'll convert the 20-shot series into 20 series of one shot and it should graph it correctly then.

Edit: There are a couple rough edges in the current version with how it handles single-shot series, but it displays and graphs the data correctly. I recommend unchecking Show ES and Show SD for now since they don't make sense with only one shot. I'll fix that in the next version.
 
Last edited:
  • Like
Reactions: MDof2 and Holliday
I'm still shooting over a Chrony chronograph, I usually enter data into google sheets as I shoot. Is it possible to take data from google sheets, and bring it into your program? If so, how?
 
I'm still shooting over a Chrony chronograph, I usually enter data into google sheets as I shoot. Is it possible to take data from google sheets, and bring it into your program? If so, how?
Not directly - the program currently only knows how to import LabRadar and MagnetoSpeed formatted CSV files. But I can probably add support for a simple "custom" CSV format that would be easy to fit your own data into. I'll think about how best to do it.
 
Last edited:
  • Like
Reactions: Vodak and Holliday
You're treating round robin as series 1, each shot is a diff charge weight. ?
Series 2, same as 1. New series in chrono, shoot, etc. Rinse repeat.
Load into your program and it parses each series and stacks them if there are multiple series. Multiple shots of same charge weights. ?
 
You're treating round robin as series 1, each shot is a diff charge weight. ?
Series 2, same as 1. New series in chrono, shoot, etc. Rinse repeat.
Load into your program and it parses each series and stacks them if there are multiple series. Multiple shots of same charge weights. ?
Yes, exactly. For example, say you have three series in your chronograph. Each of those series contains five shots with different charge weights 40.0gr, 40.1gr, 40.2gr, 40.3gr, and 40.4gr.

So long as the charge weights are shot in the same order each time, you can use the round-robin feature to convert those three series of five shots, into five series of three shots. The new Series 1 will contain the three 40.0gr shots, the new Series 2 with the 40.1gr shots, and so on...

As mentioned abive, this same feature lets us handle Satterlee testing as well since Satterlee is basically a “one shot round-robin” test.
 
  • Like
Reactions: MDof2
Thanks, and yes, that's (Satterlee method) generally my preferred method of load dev. for velocity nodes.

This makes data aggregation and analysis of that method much simpler.
 
  • Like
Reactions: mc10
I was working on something similar, but you've done a much better job - thanks for making this open source!
 
Spent some time with the tool today. One item to improve is to remember the last directory browsed to open file or to save graph. another improvement is to auto fill the save graph filename with the description.
 
Played with it again today for a single string to get a velocity node. Hattip once again. Nice / smooth little program.

1. Can I remove that "X:" from the label in a round robin scenario?
2. "Are you sure you want to exit?" for fat finger fvcks like me.
3. Export to CVS/Excel (although I know this is a little more detailed)

Again, huge props. Nice tool for looking at data. Will tinker more with it when I get back out to stack data on depth testing and aggregate SD's

6YzABIM.png
Thanks! Glad it's been helpful.

1. I have a new version in the works that removes the x̄ character, ES, and SD when displaying one-shot strings. Will be in the next release.
2. Good idea, will look into adding a confirm on exit dialog.
3. Could you explain more what you mean by exporting to CSV/Excel? Do you mean like a CSV summary file separate from the chrono CSV file?

I'm also working on adding seating depth vs. group size support. It'll be unrelated to parsing chrono files, will just provide a clean/easier interface to enter your seating depth/group size data and create a graph.

I got a bit sidetracked though, I'm currently rewriting the program from the ground-up (in C++). I use a tool PyInstaller to create the .exe file and Chrome isn't liking something about it and flagging the downloads. This rewrite should fix the issue, as well as make significantly smaller and faster .exe files. I'll hopefully have it done soon.
 
Played with it again today for a single string to get a velocity node. Hattip once again. Nice / smooth little program.

1. Can I remove that "X:" from the label in a round robin scenario?
2. "Are you sure you want to exit?" for fat finger fvcks like me.
3. Export to CVS/Excel (although I know this is a little more detailed)

Again, huge props. Nice tool for looking at data. Will tinker more with it when I get back out to stack data on depth testing and aggregate SD's

6YzABIM.png
I just released v1.3.1 on the site with these updates:
  • Removed unnecessary graph annotations from one-shot series
  • Remember previous directory for loading chronograph data and saving graph images
  • Graph title is now used as default save filename
Figured I'd get those features out instead of waiting. You can download it from the main page or directly from here: https://github.com/mncoppola/ChronoPlotter/releases/tag/v1.3.1. Chrome currently isn't giving any trouble with it, let me know if you have any issues!
 
3. Could you explain more what you mean by exporting to CSV/Excel? Do you mean like a CSV summary file separate from the chrono CSV file?
Essentially, yes. Gives the user the ability to later play with the data, save, modify, tweak the graph, (or great a different style) etc. in Excel and save for later use.

Right now there's no option to do anything once you have the data other than save an image or display a chart.
It could be useful to be able to spit this into Excel for later use or reference. I don't have a use case specifically, just thinking out-loud.
Good idea, added to the list. It shouldn't be too complex to generate a "save file" of the session, and it makes sense if you want to re-load the data and change something about the graph in the future
 
Love the work. Keep it up. Just for folks who aren't into paying for excel, maybe export to a libre office format with the data in tables as well as graphed just like your app.
 
  • Like
Reactions: mc10
@mc10, really good idea and nice work.

I built a web site to track all of my reloading data. It includes the rough code to capture data from my chronograph. Here's the gist of how it works:
  1. The chronograph physically connects to my phone where the Caldwell app is running
  2. The app logs shot data to a CSV
  3. When done shooting I email the log from phone to a dedicated email
  4. The web site periodically checks the email account for new messages
  5. When new messages are found the attached logs are processed putting the data into my database
Graphing is done with Highchart's Javascript library. The rest of the site is PHP (with Codeigniter) and Bootstrap.

The crazy part - I built this and have never used it beyond testing during development; I just don't use a chronograph. I should simply for the fact that it creates shots/shot groups for me. Without it I have to create them on the site myself - no big deal though. The rest of the site is the primary focus and what gets used.
 
Last edited:
@mc10, really good idea and nice work.

I built a web site to track all of my reloading data. It includes the rough code to capture data from my chronograph. Here's the gist of how it works:
  1. The chronograph physically connects to my phone where the Caldwell app is running
  2. The app logs shot data to a CSV
  3. When done shooting I email the log from phone to a dedicated email
  4. The web site periodically checks the email account for new messages
  5. When new messages are found the attached logs are processed putting the data into my database
Graphing is done with Highchart's Javascript library. The rest of the site is PHP (with Codeigniter) and Bootstrap.

They crazy part - I built this and have never used it beyond testing during development; I just don't use a chronograph. I should simply for the fact that it creates shots/shot groups for me. Without it I have to create them on the site myself - no big deal though. The rest of the site is the primary focus and what gets used.
Thanks! Sounds like an awesome setup. I considered making ChronoPlotter into a web app initially, but Javascript isn't my forte. If you're okay with sharing some of your CSV files, I can try adding Caldwell support as well
 
@mc10 I seem to be having issues. I have 5 series on my sd card. series 2-4 are a load development of 11 shot in each at different weights. The program is only seeing series 4 when I hit the select directory. Any idea to fix this? The data shows up fine on the LR and when I open the files from the SD card shows in excel with no issues.
 
@mc10 I seem to be having issues. I have 5 series on my sd card. series 2-4 are a load development of 11 shot in each at different weights. The program is only seeing series 4 when I hit the select directory. Any idea to fix this? The data shows up fine on the LR and when I open the files from the SD card shows in excel with no issues.
Just pm'd, I can take a look at what's causing it
 
I was the cause for the change. My bad. Thank you for a great tool. More importantly thank you for the time you took to help me. Is there a way to donate to your project?
 

ChronoPlotter v2.0.0​

Updates in this version:
  • Added support for graphing seating depth data
  • Improved UI for selecting LabRadar vs MagnetoSpeed data
  • Complete project rewrite in C++ and qcustomplot (drops PyInstaller and matplotlib dependencies)
  • Significant performance improvements and reduction in executable sizes (-60% for Windows, -80% for MacOS)
  • Both Windows and MacOS executables are now code signed
Downloads:


This release introduces a major new feature... creating graphs for seating depth testing! By using this feature, shooters can plot cartridge length vs. group size and more easily identify seating depth nodes.

For example:
seating_graph.png

I'm exploring ways to further automate the process of inputting group size data, including using image processing and integrating with other ballistics apps. Let me know if you have any suggestions to improve this feature, or any further feature requests.

logo.png


Last edited:
Haven't gotten to try this out yet but from what I've read its a great program. I've got an idea similar to this for an app, one that also measures group sizes like range buddy/SubMOA/BallisticX.