• Watch Out for Scammers!

    We've now added a color code for all accounts. Orange accounts are new members, Blue are full members, and Green are Supporters. If you get a message about a sale from an orange account, make sure you pay attention before sending any money!

Rifle Scopes Comparing field of view

JWEM

Private
Full Member
Minuteman
Mar 2, 2010
24
0
37
Surrey, England
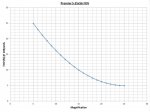
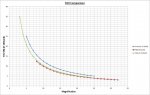
I'm looking for a new scope to replace my NXS 8-32x56 as the field of view (FOV) on low power is far too small for the type of shooting that I do these days. I've created a graph to try and get a visual representation of all the models that I'm considering and their FOV's at different magnification settings. (see attachment)

All the data is from manufacturer websites and has not been tested in any way. Could anyone with a bit more experience say if what the graph shows is anywhere near the truth i.e. dose the FOV reduce in a linier fashion as magnification increases?

Cheers.

JWEM
 

Attachments

  • Scope FOV.pdf
    5.4 KB · Views: 32
There's several things that don't add up with those graphs. First of all some of the scopes (at least ATACR, NXS F1, PMII) have tunneling, so the FOV stays constant from low power for a while, then declines proportionally as with the others. There is a formula how to calculate this, but it's not that straightforward. Then some individual values are off (e.g. PMII and Premier have ~same FOV on 25x).

Most importantly, the linear scale for the x-axis doesn't work like that. FOV increases in a proportional manner as you decrase power (double of min. FOV at half of max. power), and because of this, you cannot just draw a straight line between min. and max. power like in your graph. The line would have to follow an 1/x-function in order to represent the real values between min. and max.

If you're not totally confused by now and think you want to dive deeper, I can try a more extensive explanation.
 
Last edited:
Yeah, I didn't think it was going to be that easy but worth a try. The numbers for the PMII and Premier match the numbers given on the manufacturer websites, if that's what you mean. I myself don't understand why there would be such a big difference between the two, especially at the low end.

I'm defiantly interested in trying to work this out and not totally confused by what you have said (a little maybe) but if you've got the time to write up a more extensive explanation I would like to hear it.

Cheers

JWEM
 
JWEM, good work, atleast it gives a idea how FOV compare between theirs scopes.
 
This is what a diagram like that looks like with (almost) real data. I took three scopes with overlapping magnification ranges as an example (scopes without tunneling to keep it easy for starters). You can see that if you just connect min. and max. FOV with a straight line, things will look very different (and incorrect) in between min. and max. magnification, for example the 1-8x at 4x would seem to have about twice as much FOV as it actually as.


I'll get to the finer points tomorrow.
 
Yeah that's very different from my attempt. I've been playing around with Excel and I could be getting somewhere, if just I had remembered more of what was taught in school!

So far I have converted my FOV from feet @100yards to decimal degrees and plotted the min. mid. and max. FOV for one scope (mid. being double the FOV at max. magnification). Applied a polynomial trend line to the points and taken the equation that this has given me (I think this is a quadratic equation). I have then used this equation to work out FOV's for the rest of the power range.

My results for the Premier 5-25x56:

JWEM
 

Attachments

  • FOV Graph.jpg
    FOV Graph.jpg
    88.9 KB · Views: 17
Disregard that last post, I was wrong again.

If you have the FOV at highest magnification, then half it and multiply the FOV by 2. Do this a few times by halving the magnification and doubling the FOV you can plot the results in Excel and get a power formula for the trend line.

Mag FOV(deg)
25 0.955
12.5 1.91
6.25 3.82
3.125 7.64
1.5625 15.28

Plot this on a graph and it gives the formula y=23.875x^-1, apply this to the magnification range of the scope and convert degrees back to feet at 100yards.

This will also show if a scope has a lot of tunnelling as the FOV numbers generated by the formula at low magnification will be bigger that the ones manufacturers give for the same setting.

I'm I close this time?

JWEM
 

Attachments

  • FOV2.jpg
    FOV2.jpg
    94.8 KB · Views: 17
If you have the FOV at highest magnification, then half it and multiply the FOV by 2. Do this a few times by halving the magnification and doubling the FOV you can plot the results in Excel and get a power formula for the trend line.

That's exactly right. Also, you can visualize the tunneling this way. If you calculate from high towards low power and generate your graph, you will reach the maximum FoV at some point before minimum magnification is reached. From that point on, the graph will just be a horizontal line until min. magnification.

A quick check for tunneling from a datasheet is dividing max. FoV by min. FoV and max. magnification by min. magnification. If the former ist a smaller number, there is some tunneling. To calculate the approximate point where tunneling starts, just divide max. magnification by (max. FoV/min. FoV).

Note that there are often small errors in published magnification, min. and max. magnification are usually nominal values and actual values may differ slightly, and geometric distortion at low power (which is differing magnification with image radius) may throw the results off a little, so don't fret over smaller inconsistencies. Without actually measuring FoV and magnification of the scope, you will only get a (usually pretty good) approximation only.