Join the Hide community
Get access to live stream, lessons, the post exchange, and chat with other snipers.
Register
Download Gravity Ballistics
Get help to accurately calculate and scope your sniper rifle using real shooting data.

Install the app
How to install the app on iOS
Follow along with the video below to see how to install our site as a web app on your home screen.
Note: This feature may not be available in some browsers.
You are using an out of date browser. It may not display this or other websites correctly.
You should upgrade or use an alternative browser.
You should upgrade or use an alternative browser.
Weight sorting brass
- Thread starter Sniper King 2020
- Start date
And he started off with good brass that was plus/minus 1 grain. Imagine if he had brass that was plus/minus 2 or 3 grains.
Exactly what I was wondering…perhaps the effect would be even greater in brass that has larger variations in weight.And he started off with good brass that was plus/minus 1 grain. Imagine if he had brass that was plus/minus 2 or 3 grains.
What would happen if you got a “light” lot from Norma such that the weights across the box were all shifted down half a grain? Do you think these results had something to do with the weights themselves or with the the light and heavy test groups representing outliers in the lot?
I’m no statistician so I apologize if your results and tests address this in some way I don’t understand.
I’m no statistician so I apologize if your results and tests address this in some way I don’t understand.
Good point. The test does not directly address lot-to-lot variation this since the brass pieces were from the same lot. Based on this particular test and not knowing if there were other similar type(s) of tests done, we don’t know. For now, in the absence of other test(s) like this, I suggest weight sorting and using the brass from the average weight range.
Your question is the reason why I post my tests to these types of forums so I can see if anybody has tested other aspects of what I test so they can add finer points or, at least, give ideas for further testing.
Your question is the reason why I post my tests to these types of forums so I can see if anybody has tested other aspects of what I test so they can add finer points or, at least, give ideas for further testing.
At least cull the high and low outliers (from a large enough sample).
I use them for dummy rounds.
I use them for dummy rounds.
No, actually we don’t. I’m not sure of the evidentiary standard for your claim. I encourage you to study up on research methods/science and statistics before making such false and misleading claims.We need hundreds of these tests for this exercise to be statistically valid.
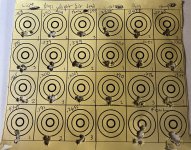
That's what I did for a test to see what the difference might be. For a box of .308 Lapua brass, I sorted them (see pic below) and compared the difference I found with that of those from the same weight.At least cull the high and low outliers (from a large enough sample).
I use them for dummy rounds.
I fired 5 of the lowest outliers and 5 of the highest outliers and found significant difference in average velocity (this test was repeated 3 times with the same cases). Then I took 10 cases of the same weight (see column in picture below for 172.8-9) and run the same test 3 times firing two 5 round groups. The average velocities for each of the sets of 5 outlier cases was as consistent those of the same weight, though the velocities were not the same and the POI's between the high and low outliers were not the same. Those of the same weight, each 5 round group were very consistent in all 3 tests.
While I found no direct correlation between any of the case's weight and volume, as an average of a group of case weights, I find there's often a notable difference in what I get on paper when there's a 3 gr or more spread . . . especially at distance.
But, bUt, buT,
Lapua brass is soooo consistent.
3 grain spread is about 1.7%
Was this Chinese Lapua?
Kidding")
Lapua brass is soooo consistent.
3 grain spread is about 1.7%
Was this Chinese Lapua?
Kidding
Snipers Hide will require a minimum of 10,000 replications before even considering that the data has any meaningful weightYes we will. This is Snipers Hide Reloading!

Looks like both our tests suggest that weight sorting cases is a good practice. Thanks for posting this.That's what I did for a test to see what the difference might be. For a box of .308 Lapua brass, I sorted them (see pic below) and compared the difference I found with that of those from the same weight.
I fired 5 of the lowest outliers and 5 of the highest outliers and found significant difference in average velocity (this test was repeated 3 times with the same cases). Then I took 10 cases of the same weight (see column in picture below for 172.8-9) and run the same test 3 times firing two 5 round groups. The average velocities for each of the sets of 5 outlier cases was as consistent those of the same weight, though the velocities were not the same and the POI's between the high and low outliers were not the same. Those of the same weight, each 5 round group were very consistent in all 3 tests.
While I found no direct correlation between any of the case's weight and volume, as an average of a group of case weights, I find there's often a notable difference in what I get on paper when there's a 3 gr or more spread . . . especially at distance.
View attachment 8014535
Where NOTHING is provable!Yes we will. This is Snipers Hide Reloading!
I see so many post comments that are irrelevant and throw people for an unnecessary loop. Of course, there is no data-driven rationale for it. Gotta be careful who you are willing to listen to!Where NOTHING is provable!
A few data points on the subject matter . . . .


....
....
Last edited:
It would be interesting to see if lubing the necks made any difference.
. . . you mean in terms of equalizing those with significant difference in case weight?
BTW: Those cases I tested (show in the picture I posted above) were neck turned and annealed after every firing and trimmed to the same length. The inside of the necks were not cleaned as the powder residue is left on the interior to provided plenty of "lubing". Bullet seating for them was very consistent and not with a lot of pressure, where my sizing with .0015 of neck tension with a Lee collet die helps with that too.
Mainly just to see if the lighter cases would group better with lubed necks.
hallo
so if i understand correctly; you didnt find any velocity variance between your light and heavy brass?
your metric for group size is 'average to center' or just the biggest group size from two most distant shots?
and you shot 5-shot groups?
sincerely
A few data points on the subject matter . . . .
No velocity differences, and groups were 5-shot measured center-to-center.hallo
so if i understand correctly; you didnt find any velocity variance between your light and heavy brass?
your metric for group size is 'average to center' or just the biggest group size from two most distant shots?
and you shot 5-shot groups?
sincerely
nice findings, but wrong conclusion.
if there were no differences in velocity, than it's pointless to weight sort brass. bad groups are your fault and too small sample, not fault of the brass weight.
if there were no differences in velocity, than it's pointless to weight sort brass. bad groups are your fault and too small sample, not fault of the brass weight.
We finally got one of those irrelevant comments! Yay!nice findings, but wrong conclusion.
if there were no differences in velocity, than it's pointless to weight sort brass. bad groups are your fault and too small sample, not fault of the brass weight.
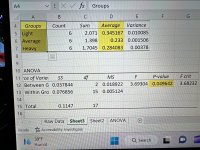
Just in case anybody is taking the MarkyMark comment seriously, the sample size is more than adequate to detect a difference because it did detect a difference. The sample size needed to detect a difference is largely determined by how much of a difference you expect to find - larger differences = smaller sample sizes and small differences = larger sample sizes. Since a difference was detected, the sample size was adequate. The MarkyMark post is a perfect example of the “irrelevant” post and the type of post that can needlessly throw people for a loop because it was uninformed by actual statistical principles. An informed post would say “sample size was adequate because the ANOVA detected a difference.”
We finally got one of those irrelevant comments! Yay!
Just in case anybody is taking the MarkyMark comment seriously, the sample size is more than adequate to detect a difference because it did detect a difference. The sample size needed to detect a difference is largely determined by how much of a difference you expect to find - larger differences = smaller sample sizes and small differences = larger sample sizes. Since a difference was detected, the sample size was adequate. The MarkyMark post is a perfect example of the “irrelevant” post and the type of post that can needlessly throw people for a loop because it was uninformed by actual statistical principles. An informed post would say “sample size was adequate because the ANOVA detected a difference.”
That's not the same thing as showing that it's a reliable result. Getting a statistically significant result in one test doesn't mean it's a settled conclusion. "Statistically significant" tests do not mean that robust, reliable conclusions are being drawn.
Specifically, data anomalies and omitted variable bias are very real things, as well as correlated errors and things like that that break the underlying statistical assumptions of your tests.
For instance what happens to the result if you omit "group 3" from the test? Small samples are very sensitive to outliers in the data.
Can you post a picture of the target with the groups/weights labeled?
Attachments
Seems like your pulling a strawman here by first mentioning sample size and then later replicability. Two different concepts. The sample size was adequate to detect the difference…that much is simple. As for replicating the test, yes, by evidentiary standards we would want more replications to strengthen the conclusions. This is why I post these tests to forums like this to see if others have tested similarly. There is a post on this thread that showed that somebody did a similar test and found differences in precision based on the case weights which is the root finding from my test. Seems like the evidence is mounting. As for other variables, there are many controls built in to my tests that rule out or mimimize to a great degree the other variables.That's not the same thing as showing that it's a reliable result. Getting a statistically significant result in one test doesn't mean it's a settled conclusion. "Statistically significant" tests do not mean that robust, reliable conclusions are being drawn.
Specifically, data anomalies and omitted variable bias are very real things, as well as correlated errors and things like that that break the underlying statistical assumptions of your tests.
For instance what happens to the result if you omit "group 3" from the test? Small samples are very sensitive to outliers in the data.
The codes for the various weights are by column so column 1 is light, 2 is average, and 3 is heavy and then it starts back over on the next three columns. The numbers 1, 2, and 3 written on the target is the order the groups were shot on the same day. I shoot the codes in different orders to eliminate order effects. I have a coder code the various weights prior to the test to make the test blind. After the test is done and the data is input and analyzed, I open the sealed code envelope to see what the codes mean and then write them on the target and include them in the database. In this case, my coder was clever and ordered them in a linear fashion - light, average, and heavy. My coder doesn’t always code them in a linear way…just so happens this is how the coder did it for this test.Are the groups in the vertical columns or labeled by 1,2,3- light, avg, heavy?
FYI - a recent thousand yard bench rest world record holder contacted me about this test and asked that I remove the first set of groups because those were the fire forming loads. The rationale was that nobody shoots a match with fireforming loads and so I precluding that from a the analysis would give a cleaner indication of whether there were differences in the various weight sorting categories for those who do not shoot fire forming loads at matches. I went ahead and did this, and I actually found that the statistical significance was still below .05, and so, even with removing an entire set of data for the test, the test still comes out statistically significant with the exact same differences between the weight sort groups. I guess this also shows that the sample size was more than adequate and could’ve been smaller to detect the difference.
Attachments
I would love to see a test proving sorting cases by weight, actually leads to a difference in volume of the powder column. Lots of material in the case head.
Seems like your pulling a strawman here by first mentioning sample size and then later replicability. Two different concepts. The sample size was adequate to detect the difference…that much is simple. As for replicating the test, yes, by evidentiary standards we would want more replications to strengthen the conclusions. This is why I post these tests to forums like this to see if others have tested similarly. There is a post on this thread that showed that somebody did a similar test and found differences in precision based on the case weights which is the root finding from my test. Seems like the evidence is mounting. As for other variables, there are many controls built in to my tests that rule out or mimimize to a great degree the other variables.
No, it's not a strawman. Perhaps you think I'm making an argument that I'm not. I did not say your results didn't meet your criteria for statistical significance. Nor did I say that I think your hypothesis is wrong, for that matter. I am saying that "statistically significant" isn't some magical thing that separates true from false. Further, all we have to do is change our standards for significance, and it goes away. What if we require an alpha of 0.01 instead of 0.05?
While sample size and replicability may be two different concepts, when it comes to small samples (which your is), replicability is prescribed prior to drawing major conclusions... so the comments about sample size are not as irrelevant as you might hope they are. Replication is one form of larger sample size. The point being, you should be careful claiming your test means more than it does. Looking at your data, there is the obvious chance that one bad group caused the entire result. This is why I mentioned one of the checks that is frequently done in test like this, outlier testing. In small samples, one weird observation can create a "significant" result. What actually happens is that small samples often underrepresent the true population variance, and if you get one oddball observation, it tests as significant, even though in reality it's just a small sample effect. That's the origin of the whole n-1 adjustment to variance, after all.
So, once again, what happens to your results if one labeled "group 3" on the X-axis of your group size chart at minute 3 is removed?
When I start tuning a load for a rifle or want to see the true potential the rifle has, I will weight sort brass first. If you dont think is a relevent task, then don’t.
I don’t see any outliers that could have driven anything in one direction or the other. The outlier analysis didn’t indicate there was an outlier. After removing a set of data with what could be an outlier, the p value was still below .05. Say what you will about the arbitrary nature of .05 or .01 but having 95% confidence that an entire distribution of various values is not random is enough for me and almost all of the scientific community. The armchair theoretical points you make don’t have a bearing on this accepted practice…if it did, then we wouldn’t be able to use statistics for anything to help us understand any of the phenomenon studied in science. Feel free to armchair all day and come up with reasons to dismiss anything but please don’t use that to potentially mislead people from considering what is likely important to precision shooting.No, it's not a strawman. Perhaps you think I'm making an argument that I'm not. I did not say your results didn't meet your criteria for statistical significance. Nor did I say that I think your hypothesis is wrong, for that matter. I am saying that "statistically significant" isn't some magical thing that separates true from false. Further, all we have to do is change our standards for significance, and it goes away. What if we require an alpha of 0.01 instead of 0.05?
While sample size and replicability may be two different concepts, when it comes to small samples (which your is), replicability is prescribed prior to drawing major conclusions... so the comments about sample size are not as irrelevant as you might hope they are. Replication is one form of larger sample size. The point being, you should be careful claiming your test means more than it does. Looking at your data, there is the obvious chance that one bad group caused the entire result. This is why I mentioned one of the checks that is frequently done in test like this, outlier testing. In small samples, one weird observation can create a "significant" result. What actually happens is that small samples often underrepresent the true population variance, and if you get one oddball observation, it tests as significant, even though in reality it's just a small sample effect. That's the origin of the whole n-1 adjustment to variance, after all.
So, once again, what happens to your results if one labeled "group 3" on the X-axis of your group size chart at minute 3 is removed?
There's really no question that heavier cases will have less internal volume than lighter cases resulting in higher pressures that push the projectile faster, which can change POI's. Molon's post above illustrates that clearly in terms of velocity. The issue here is really whether there's enough of a relationship for case weight to internal volume that makes enough of a difference to justify sorting cases by weight. Because there can such a difference in case weight to internal volume on any individual case due to distribution of the brass alloy through out a case, to quantify the relationship of a set of cases can be difficult. But, if there's a significant difference between high and low outliers, sorting them out can be a measurable benefit; and how much benefit really depends on the type of shooting one is doing. Like if one is only loading for hunting to take down game at 200 yds. or less, small improvements that might be achieved by soring out outliers for a long range benefit is pointless.
The facts are that there's a relationship for case weight to case volume. Variance in the distribution of the material of the cases muddies up the waters making it difficult to quantify. The more uniform the cases are the less one is going to able to find any benefit to sorting for the variances by weight. But, one will not know how much variance there really is unless the cases are measured.
The facts are that there's a relationship for case weight to case volume. Variance in the distribution of the material of the cases muddies up the waters making it difficult to quantify. The more uniform the cases are the less one is going to able to find any benefit to sorting for the variances by weight. But, one will not know how much variance there really is unless the cases are measured.
Yes and I’m an ideal world we would have perfectly uniform cases with minimal to no weight and volume variation. Unfortunately, this magical world doesn’t exist quite yet or if it does, I haven’t been there (do tell though if you know where I can find itThere's really no question that heavier cases will have less internal volume than lighter cases resulting in higher pressures that push the projectile faster, which can change POI's. Molon's post above illustrates that clearly in terms of velocity. The issue here is really whether there's enough of a relationship for case weight to internal volume that makes enough of a difference to justify sorting cases by weight. Because there can such a difference in case weight to internal volume on any individual case due to distribution of the brass alloy through out a case, to quantify the relationship of a set of cases can be difficult. But, if there's a significant difference between high and low outliers, sorting them out can be a measurable benefit; and how much benefit really depends on the type of shooting one is doing. Like if one is only loading for hunting to take down game at 200 yds. or less, small improvements that might be achieved by soring out outliers for a long range benefit is pointless.
The facts are that there's a relationship for case weight to case volume. Variance in the distribution of the material of the cases muddies up the waters making it difficult to quantify. The more uniform the cases are the less one is going to able to find any benefit to sorting for the variances by weight. But, one will not know how much variance there really is unless the cases are measured.
). For now, we can sort and shoot and see what happens. Turns out in my test, something happened and it wasn’t random.Now that I’ve had more than a few comments about case volume, it would be interesting to test the interaction between weight and volume. There is a tool to measure volume and some financial support through my Patreon account would enable me to get the tool and do the testing. Until then, weight sorting will be the practice.
I don’t see any outliers that could have driven anything in one direction or the other. The outlier analysis didn’t indicate there was an outlier. After removing a set of data with what could be an outlier, the p value was still below .05. Say what you will about the arbitrary nature of .05 or .01 but having 95% confidence that an entire distribution of various values is not random is enough for me and almost all of the scientific community. The armchair theoretical points you make don’t have a bearing on this accepted practice…if it did, then we wouldn’t be able to use statistics for anything to help us understand any of the phenomenon studied in science. Feel free to armchair all day and come up with reasons to dismiss anything but please don’t use that to potentially mislead people from considering what is likely important to precision shooting.
What set did you remove, and what were the results? I was being specific, and it's easy enough to post the results.
The first. Again though, there were no actual outliers so the selection of that particular set was actually driven by a request from a shooter to eliminate the fireform set with the rationale that most shooters at matches for extreme precision are not fireforming loads. For that rationale (a relevant and realistic rationale vs armchair), I removed it and reran the analysis. Results were the same.What set did you remove, and what were the results? I was being specific, and it's easy enough to post the results.
The first. Again though, there were no actual outliers so the selection of that particular set was actually driven by a request from a shooter to eliminate the fireform set with the rationale that most shooters at matches for extreme precision are not fireforming loads. For that rationale (a relevant and realistic rationale vs armchair), I removed it and reran the analysis. Results were the same.
Ok, that's not the group that I was asking about. But I see you're not interested in it.
As for armchair... LOL.
Here's some data from my spreadsheets that I've collected for some of the brass I've used and one from Peterson Cartridge company that might be insightful for some along this line:Yes and I’m an ideal world we would have perfectly uniform cases with minimal to no weight and volume variation. Unfortunately, this magical world doesn’t exist quite yet or if it does, I haven’t been there (do tell though if you know where I can find it
Now that I’ve had more than a few comments about case volume, it would be interesting to test the interaction between weight and volume. There is a tool to measure volume and some financial support through my Patreon account would enable me to get the tool and do the testing. Until then, weight sorting will be the practice.
Again, no actual outliers so no rationale to remove data. I esp would not arbitrarily remove data for the sake of an armchair exercise…maybe for teaching stats which I have done plenty of times but not for live/actual datasets. If I started doing that, I’d be characterized as a quack. I’m not going down that road.Ok, that's not the group that I was asking about. But I see you're not interested in it.
As for armchair... LOL.
Is that Peterson data somewhere on the web where I can download it in some kind of raw data file format like Excel? Seems ripe for a multiple regression to see if certain measurements predict case volume and weight.Here's some data from my spreadsheets that I've collected for some of the brass I've used and one from Peterson Cartridge company that might be insightful for some along this line:
View attachment 8016005
View attachment 8016006
I don't recall where I downloaded it directly from, but I do have their file in Excel. But since I can't download an Excel file here, I can change the extension to "PDF" so you can download it here. After you've downloaded the file you'll need to change the extension back to .xlsx to get at the data.Is that Peterson data somewhere on the web where I can download it in some kind of raw data file format like Excel? Seems ripe for a multiple regression to see if certain measurements predict case volume and weight.
Attachments
Thanks! Always appreciate posts like this that help us to advance our understanding.I don't recall where I downloaded it directly from, but I do have their file in Excel. But since I can't download an Excel file here, I can change the extension to "PDF" so you can download it here. After you've downloaded the file you'll need to change the extension back to .xlsx to get at the data.
An equivalent statement is "I'm worried about what it might show".Again, no actual outliers so no rationale to remove data. I esp would not arbitrarily remove data for the sake of an armchair exercise…maybe for teaching stats which I have done plenty of times but not for live/actual datasets. If I started doing that, I’d be characterized as a quack. I’m not going down that road.
Also, I'll be sure to tell the next person to bring up Cook's D that they are a quack. A stat teacher told me so.
You are free to interpret integrity in whatever fashion you please. Have fun with the armchair and what it showsAn equivalent statement is "I'm worried about what it might show".
Also, I'll be sure to tell the next person to bring up Cook's D that they are a quack. A stat teacher told me so.
every serious shooter is now using average-to-centre measurement of the groups. army uses even more sophisticated metrics. but here we have max shot-to-shot group size...
There's really no question that heavier cases will have less internal volume than lighter cases resulting in higher pressures that push the projectile faster, which can change POI's...
if you could read and understand this topic, zolnikof is getting NO DIFFERENCE in velocity between light and heavy brass !
OMG! Stop the press!if you could read and understand this topic, zolnikof is getting NO DIFFERENCE in velocity between light and heavy brass !
I’m finding this thread to be super funny. I get the empty heckler trying to manipulate me to fudge the data for no good reason and now what appears to be drunk posts.
Stay classy snipershide!