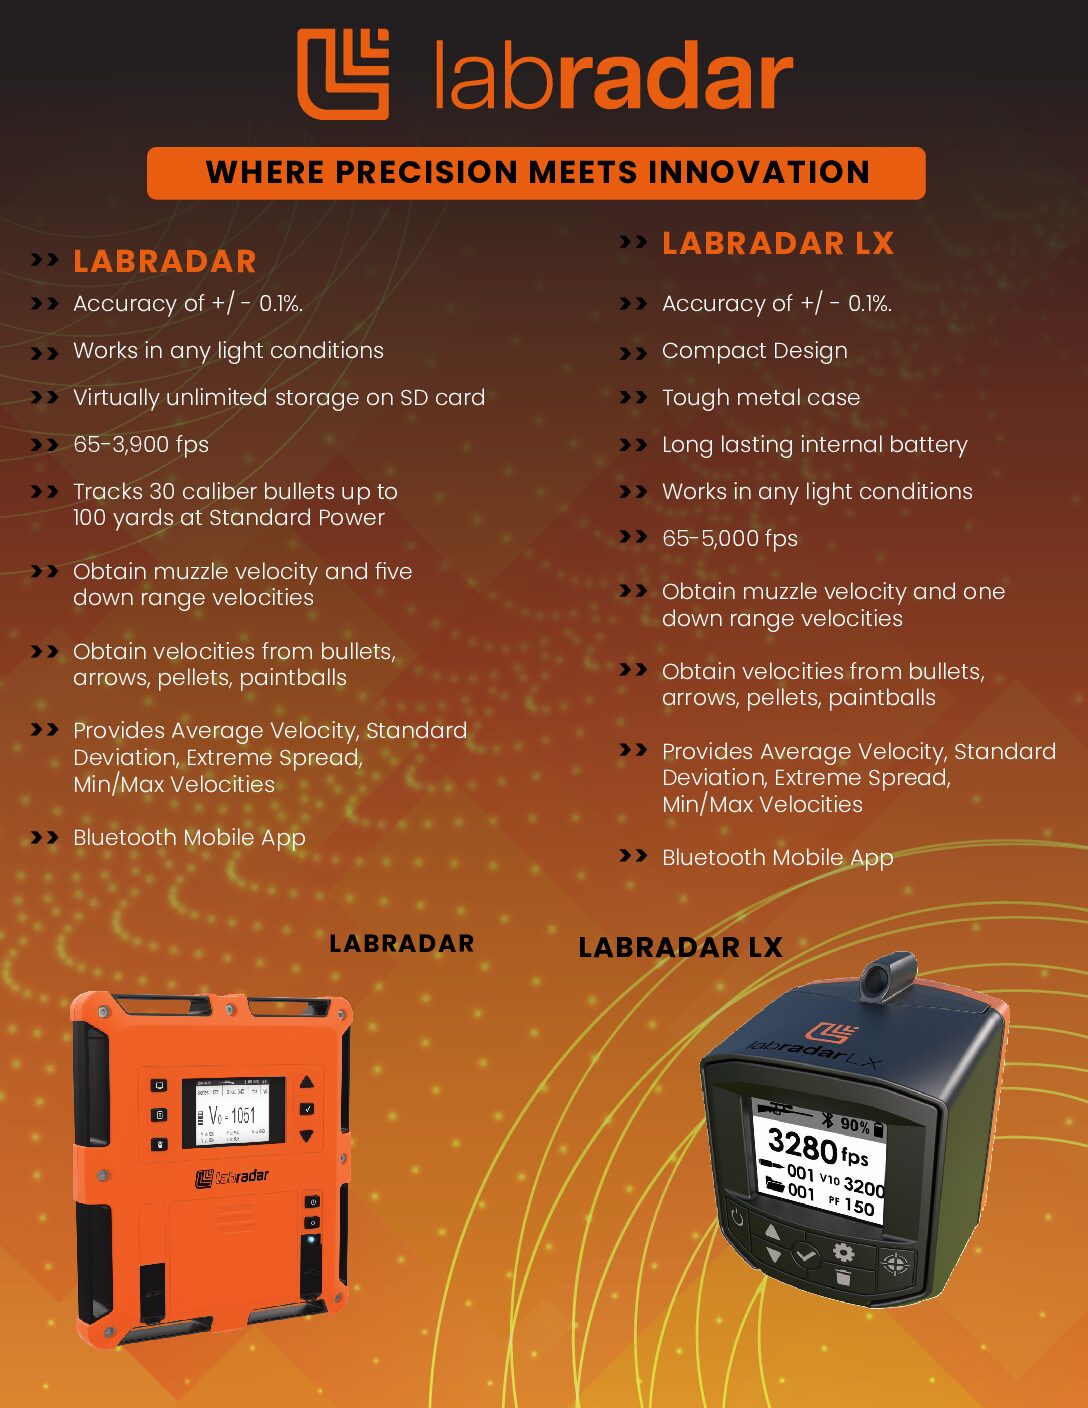
I'm working now to compile some data from one of my preliminary comparisons depicted above. I had to eliminate two units from the test to prevent co-channel interference, but while I was conducting the interference test, I shot a 100rnd string of 22LR ammo (rot gut stuff, just for preliminary evaluation of the method) across 3 pairs of LabRadar LX, Garmin Xero C1, and Athlon Rangecraft Velocity Pro's.
Overall, for 100rnds, after my first few outings with the Athlons, this dataset was much more compelling than I expected. We can see here, the ES and SD's are relatively similar, the ES's appear to vary more than they really are, since the numbers are so ridiculously big for this terrible ammo, but 231.7 vs. 242.3 is still only a ~4% spread, and 32.7SD vs. 34.3SD is only ~4.8% spread, and considering this ammo, I'm not terribly disappointed at this point. More rimfire and similar centerfire testing to come which may confirm or correct that observation.
View attachment 8698328
I expected in the outset of designing this experiment that I would see relatively persistent offsets between units - meaning one unit would read higher than another, or lower, regularly. This persisted both within each brand (less so for the Athlons) as well as between the 3 brands. Reading the data itself isn't important, but I applied a heat map to the data for all 6 units over 100 rounds to reflect which units read the highest speed readings for each shot (highlighted green below) vs. the lowest speed (highlighted red below). The two left columns are Garmin units, two center columns are the readings from LabRadar LX's, and the right most two columns are the readings from my two Athlons. For an overwhelming majority of shots, the LabRadar LX's displayed the higher speed readings with the Athlons displaying the lower speed readings, with the Garmins floating in the middle:
--> One or both of the LabRadar LX's represented 90 of the fastest shots out of 100, and only ONE out of 100 shots did a LabRadar LX represent the slowest reading for any shot (including ties).
--> One or both of the Athlon untis represented the SLOWEST velocity reading for 89 out of 100 shots, and only represented 10 of the fastest readings (including ties).
--> One or both of the Garmins represented mid-range readings between the other brands 85 out of 100 shots, only representing the fastest shots for 5 out of 100 (including ties), and only represented the slowest readings 10 times out of 100 shots.
So 90% of the time, the LX was faster than the other two brands, and 89% of the time the Athlon was slower than the other two brands. The LX's averaged 0.8fps faster than the Garmins, which averaged 1.2fps faster than the Athlons.
***Note: Reading the specific data here isn't so important as the heat mapping - majority red in a column shows that unit reads slower more often, majority green shows that unit reads faster more often.***
View attachment 8698297
Comparing each brand to itself, there was also an offset between the units, although less decisive. One of my Garmins read faster than the other for 62 of the 100 shots and only slower for 29 of the 100, with the two units matching the displayed speed for 9 shots - meaning one unit read faster than the other more than twice as often. The two Athlons agreed 21 times, then one unit displayed faster on 47 shots and only slower for 32 shots, reading faster than the other roughly 50% more often. The LabRadar LX's display to 0.01fps rather than 0.1fps, which makes it less common to see perfect agreement (and on that date, they were not operating on the same firmware version), so there were no shots for which they displayed the exact same speed, but one unit displayed higher speed 63 times and only displayed slower 37 times, so one unit read faster about 70% more often than the other.
View attachment 8698308
The readings between each of the same brand were very close together. The worst spread displayed for ALL chronographs was 11.1fps, but 80% of the shots were less than 4.2fps separated. The 2 LabRadars were, on average, 2.1fps faster than the 2 Athlons and 0.8fps faster than the 2 Garmins. But within brands:
--> The 2 Garmins read within 0.54fps average from one another, never more than 1.9fps apart.
--> The 2 LX's averaged within 0.83fps of one another, never more than 3.9fps apart.
--> The Athlons averaged 1.1fps apart, never more than 6.5fps.
So this suggests, at least in this test, the Garmins are closer together than the LabRadars by ~50% tighter, while the Garmins are about 96% closer together on average than the Athlons. But overall, whether the average is within +/-0.5fps or +/-1.1fps, eh, not a huge difference in practical application performance.
View attachment 8698311
Unfortunately, the ammo I chose was just terrible, so the noise from one shot to the next really drowns out the difference between each chronograph reading for each respective shot. Really difficult to display the dataset with only ~3.5fps average spread between each chronograph, but 242fps spread between the fastest and slowest shot registered. This is all 6 trends depicted together, you can see they track very well up and down for the macro result, but there's slight feathering and a few crossing of the trends at the peaks and valleys where the few fps between the readings are revealed:
View attachment 8698315
In an attempt to better visualize the differences between units, and the prevailing offset trends, I ranked the shots by average velocity across the units, then charted the trendlines for a smaller velocity window, choosing 1200-1220 relatively randomly - it's a small enough velocity window to let the ~3.5fps spread between shots reveal itself in the ~20fps window, but still have ~25-30 shots for comparison. So here is a ranked velocity depiction (by average velocity) of 30 rounds.
--> The pink and purple trends floating typically near the bottom edge are the Athlon units
--> The light and dark green trends floating typically in the middle are the Garmin units
--> The peach & orange trends riding predominantly on the top are the LX units
We can see the relative noise, but also see the prevailing offset trends, and the near-parallel tracking together of all of units as the ranked velocity increased up and up. Tighter together in some spots, looser and noisier in some spots, but just randomly so, since this represents a non-chronological series of shots.
View attachment 8698317
Overall, the results were very consistent for all 3 brands, all 6 units, and the expected behavior was demonstrated. Without yet going into volatility evaluation, I'm glad to have this info as I move this weekend and next week into further exploration.


