Join the Hide community
Get access to live stream, lessons, the post exchange, and chat with other snipers.
Register
Download Gravity Ballistics
Get help to accurately calculate and scope your sniper rifle using real shooting data.

Install the app
How to install the app on iOS
Follow along with the video below to see how to install our site as a web app on your home screen.
Note: This feature may not be available in some browsers.
You are using an out of date browser. It may not display this or other websites correctly.
You should upgrade or use an alternative browser.
You should upgrade or use an alternative browser.
What's your Demographic?
- Thread starter Nostradumbass
- Start date
Re: What's your Demographic?
<div class="ubbcode-block"><div class="ubbcode-header">Originally Posted By: BOLTRIPPER</div><div class="ubbcode-body"><div class="ubbcode-block"><div class="ubbcode-header">Originally Posted By: COURAGEWOLF</div><div class="ubbcode-body"><div class="ubbcode-block"><div class="ubbcode-header">Originally Posted By: vwhugger</div><div class="ubbcode-body"><div class="ubbcode-block"><div class="ubbcode-header">Originally Posted By: COURAGEWOLF</div><div class="ubbcode-body">29 and aging handsomely I might add. </div></div>
Not as much as me. </div></div>
 </div></div>
i'm such a poser......
 </div></div>
Holy crap!! Striking resemblance.
I used to get carded when I was a youngster going into 18 yr old beer joints 'til I was around 25. Now I'm gettin' carded trying to prove I'm a seasoned citizen just to get a discount for a damned haircut.
<div class="ubbcode-block"><div class="ubbcode-header">Originally Posted By: BOLTRIPPER</div><div class="ubbcode-body"><div class="ubbcode-block"><div class="ubbcode-header">Originally Posted By: COURAGEWOLF</div><div class="ubbcode-body"><div class="ubbcode-block"><div class="ubbcode-header">Originally Posted By: vwhugger</div><div class="ubbcode-body"><div class="ubbcode-block"><div class="ubbcode-header">Originally Posted By: COURAGEWOLF</div><div class="ubbcode-body">29 and aging handsomely I might add. </div></div>
Not as much as me. </div></div>
i'm such a poser......
Holy crap!! Striking resemblance.
I used to get carded when I was a youngster going into 18 yr old beer joints 'til I was around 25. Now I'm gettin' carded trying to prove I'm a seasoned citizen just to get a discount for a damned haircut.
Re: What's your Demographic?
Nostra, is the accomponying dot plot graph, and the standard deviation, or a box plot with the solid data? DUDE! If you are going to quote stats, do it right!
Nostra, is the accomponying dot plot graph, and the standard deviation, or a box plot with the solid data? DUDE! If you are going to quote stats, do it right!
Re: What's your Demographic?
<div class="ubbcode-block"><div class="ubbcode-header">Originally Posted By: Switchblade</div><div class="ubbcode-body">Nostra, is the accomponying dot plot graph, and the standard deviation, or a box plot with the solid data? DUDE! If you are going to quote stats, do it right!</div></div>
I did the best I could Switch.....it's possible my abacus was off one or two
Re: What's your Demographic?
47... it ain't the age, it's the mileage!
and damn- i got a lotta miles...
47... it ain't the age, it's the mileage!
and damn- i got a lotta miles...

Re: What's your Demographic?
Nostra said no teenagers......what about minx? She is a kid, right
37 sounds about right though.
Nostra said no teenagers......what about minx? She is a kid, right
37 sounds about right though.
Re: What's your Demographic?
Minx wouldn't be an 'outlier' on the stats since there are more than a few 18 y/o members. With teh many younger members at 19 - 22, 18 isn't within 2x sd's(standard deviation x2. If the sample is 3x sd it is still within the boundries, but more than 3x sd it becomes an outlier and moves the regression line out of whack for a norm) from the median or the x-bar(mean)
Minx wouldn't be an 'outlier' on the stats since there are more than a few 18 y/o members. With teh many younger members at 19 - 22, 18 isn't within 2x sd's(standard deviation x2. If the sample is 3x sd it is still within the boundries, but more than 3x sd it becomes an outlier and moves the regression line out of whack for a norm) from the median or the x-bar(mean)
Re: What's your Demographic?
<div class="ubbcode-block"><div class="ubbcode-header">Originally Posted By: Nostradumbass</div><div class="ubbcode-body"><div class="ubbcode-block"><div class="ubbcode-header">Originally Posted By: Switchblade</div><div class="ubbcode-body">Nostra, is the accomponying dot plot graph, and the standard deviation, or a box plot with the solid data? DUDE! If you are going to quote stats, do it right!</div></div>
I did the best I could Switch.....it's possible my abacus was off one or two
</div></div>
Send me your table of data and I will give you the graph picture from my Ti-84 Plus Silver, as well as x-bar(mean), r, r2, sx, ox, n, y, x, Ex, Ex2, and the rest of the data set. You prefer dot plot, gracph, or box and whiskers to show Q1, Q3, Min, Max, and Median?
We will set up L1 for X as 1 member, 2 member, and the Y intercept(L2) will be the age
<div class="ubbcode-block"><div class="ubbcode-header">Originally Posted By: Nostradumbass</div><div class="ubbcode-body"><div class="ubbcode-block"><div class="ubbcode-header">Originally Posted By: Switchblade</div><div class="ubbcode-body">Nostra, is the accomponying dot plot graph, and the standard deviation, or a box plot with the solid data? DUDE! If you are going to quote stats, do it right!</div></div>
I did the best I could Switch.....it's possible my abacus was off one or two
Send me your table of data and I will give you the graph picture from my Ti-84 Plus Silver, as well as x-bar(mean), r, r2, sx, ox, n, y, x, Ex, Ex2, and the rest of the data set. You prefer dot plot, gracph, or box and whiskers to show Q1, Q3, Min, Max, and Median?
We will set up L1 for X as 1 member, 2 member, and the Y intercept(L2) will be the age
Re: What's your Demographic?
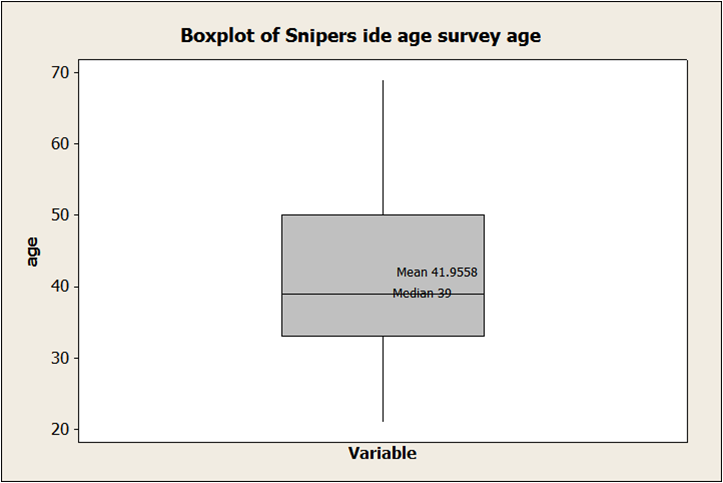
Switch, Here is what I have,kinda in a hurry
Summary for age wit 106 entries
Probability Plot of age
One-Sample T: age
Variable N Mean StDev SE Mean 95% CI
age 106 38.89 10.98 1.07 (36.77, 41.00)
Boxplot
Pie
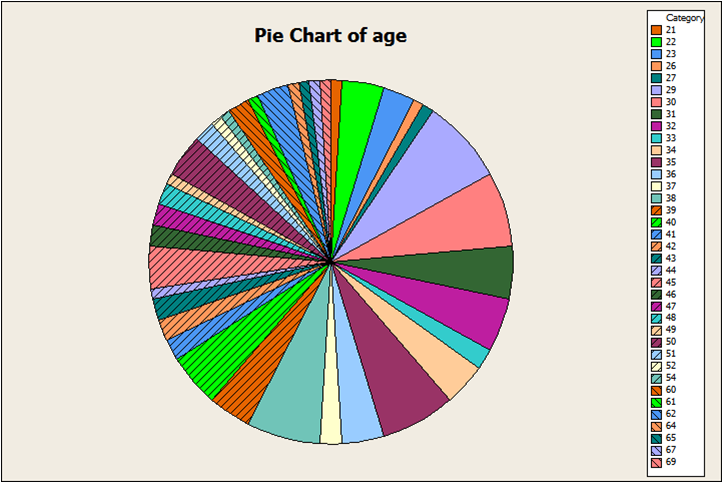
And the good stuff.

Switch, Here is what I have,kinda in a hurry
Summary for age wit 106 entries
Probability Plot of age
One-Sample T: age
Variable N Mean StDev SE Mean 95% CI
age 106 38.89 10.98 1.07 (36.77, 41.00)
Boxplot
Pie
And the good stuff.
Re: What's your Demographic?
<div class="ubbcode-block"><div class="ubbcode-header">Originally Posted By: BOLTRIPPER</div><div class="ubbcode-body"><div class="ubbcode-block"><div class="ubbcode-header">Originally Posted By: COURAGEWOLF</div><div class="ubbcode-body"><div class="ubbcode-block"><div class="ubbcode-header">Originally Posted By: vwhugger</div><div class="ubbcode-body"><div class="ubbcode-block"><div class="ubbcode-header">Originally Posted By: COURAGEWOLF</div><div class="ubbcode-body">29 and aging handsomely I might add. </div></div>
Not as much as me. </div></div>
</div></div>
i'm such a poser......
</div></div>
LMAO! Nice, Scott!
<div class="ubbcode-block"><div class="ubbcode-header">Originally Posted By: BOLTRIPPER</div><div class="ubbcode-body"><div class="ubbcode-block"><div class="ubbcode-header">Originally Posted By: COURAGEWOLF</div><div class="ubbcode-body"><div class="ubbcode-block"><div class="ubbcode-header">Originally Posted By: vwhugger</div><div class="ubbcode-body"><div class="ubbcode-block"><div class="ubbcode-header">Originally Posted By: COURAGEWOLF</div><div class="ubbcode-body">29 and aging handsomely I might add. </div></div>
Not as much as me. </div></div>
i'm such a poser......
LMAO! Nice, Scott!
Similar threads
- Replies
- 61
- Views
- 2K
- Replies
- 131
- Views
- 4K
- Replies
- 6
- Views
- 353