It all depends on the actual numbers. If you are consistently getting 2’s, 4’s and 5’s then that means you have a large sample. Every statistic someone provides should come with confidence intervals to better represent the data. The worse the actual SD, the more likely you are to get bad results with a low sample size. Shoot 30 rounds with shitty 223 ammo and look at the data in the form of 3 shot samples, some of those might come back as super low SDs. Also people use SD to say load A is better then load B but with small samples and close values, the confidence that load A is actually better then load B is going to be super low. I personally wouldn’t be happy with a 30% confidence unless I was happy with either data set. There are tricks you can do to increase the sample size. Example would be treat 40.0, 40.2 and 40.4 as one sample and compare it to 40.6, 40.8 and 41 as the second sample. You will get worse SDs but you will have more confidence which part of the charge weight range has your best load.My Chrono data looks similar to what you posted above. Yet your SD wasn't 15 when you added it all together. I think what the take away here is that if you cherry pick strings of 5 or 10, yes, your true SD is probably significantly higher. But if you're consistently getting strings with 2's, 4's and 5's, it's probably not going to climb to 20 plus over 50rnds.
Join the Hide community
Get access to live stream, lessons, the post exchange, and chat with other snipers.
Register
Download Gravity Ballistics
Get help to accurately calculate and scope your sniper rifle using real shooting data.

Install the app
How to install the app on iOS
Follow along with the video below to see how to install our site as a web app on your home screen.
Note: This feature may not be available in some browsers.
-
Quick Shot Challenge: What’s the most underrated gear you never leave home without?
Contest ends Wednesday, join now for the chance to win free Hide merch!
Join contest
You are using an out of date browser. It may not display this or other websites correctly.
You should upgrade or use an alternative browser.
You should upgrade or use an alternative browser.
Whats your SD (PRS/ELR)
- Thread starter Willie16wild
- Start date
Figure I'd post this as no one has yet. Last time this topic came up it was posted and helped me understand the numbers a little better. Maybe help others out, maybe not. Don't know if the new methods of loading such as the Auto Trickler or Prometheus change this since this is an older article? Someone smarter than me can maybe say. I think this article goes along with what Ledzeps' chart is pointing out
Perverse Nature of Standard Deviation
Perverse Nature of Standard Deviation
Last edited:
That’s a good write up. I think it’s true that a lot of stuff we do for “load development” is just useless BS in the end. Part of the problem is that it’s expensive and time consuming to prove that, and most people who shoot don’t have the training to do so anyway. Look at the Satterlee method for example—shooting a ladder over a chronograph gives you a sample size of one for each charge. You’re only ever going to see noise.Figure I'd post this as no one has yet. Last time this topic came up it was posted and helped me understand the numbers a little better. Maybe help others out, maybe not. Don't know if the new methods of loading such as the Auto Trickler or Prometheus change this since this is an older article? Someone smarter than me can maybe say. I think this article goes along with what Ledzeps' chart is pointing out
Perverse Nature of Standard Deviation
Im sure faster, easier to use, better scales improve the fictitious numbers he's using, but the points still stand. 99% of us vastly underestimate our numbers, react too drastically to small changes, and could achieve 95%+ of the performance with 50%-60% of the effort.Figure I'd post this as no one has yet. Last time this topic came up it was posted and helped me understand the numbers a little better. Maybe help others out, maybe not. Don't know if the new methods of loading such as the Auto Trickler or Prometheus change this since this is an older article? Someone smarter than me can maybe say. I think this article goes along with what Ledzeps' chart is pointing out
Perverse Nature of Standard Deviation
Also a good chance for the huge majority of us, our deficiencies or surpluses in fundementals and wind reading skills more than account for variations we see on paper/steel and blame/credit on reloading practices.
Es/Sd is highly dependent on how many shots I delete from the string on my magnetospeed before I post it on IG.
Figure I'd post this as no one has yet. Last time this topic came up it was posted and helped me understand the numbers a little better. Maybe help others out, maybe not. Don't know if the new methods of loading such as the Auto Trickler or Prometheus change this since this is an older article? Someone smarter than me can maybe say. I think this article goes along with what Ledzeps' chart is pointing out
Perverse Nature of Standard Deviation
Reading this has me wondering, since we shoot in a variety of conditions, frame of mind, health, etc. would it not be more relevant to have several, lets say 10-15 shot strings, over several shooting outings? Assuming same loads, loaded at the same time, same lots of components, etc. If you have (4) 12-shot string SDs, 7.2, 8.9, 9.4 11.1, would it be as simple as finding the mean of those 4? (in this case, the average SD would be 9.2). Someone fresher out of a stats class care to explain if there is any value there?
You can’t just average SDs, you have to have the original data (if you have ten shots with velocity 2499-2501 and ten with velocity 2999-3001, the SD of each group would be close to zero, but the SD of the twenty together would be very high).Reading this has me wondering, since we shoot in a variety of conditions, frame of mind, health, etc. would it not be more relevant to have several, lets say 10-15 shot strings, over several shooting outings? Assuming same loads, loaded at the same time, same lots of components, etc. If you have (4) 12-shot string SDs, 7.2, 8.9, 9.4 11.1, would it be as simple as finding the mean of those 4? (in this case, the average SD would be 9.2). Someone fresher out of a stats class care to explain if there is any value there?
The really problem is that often we don’t want to measure a significant number. Imagine doing load development and having to measure 25 shots from each charge weight and seating depth, maybe different neck tensions, powders, bullets. You would burn out the barrel. So we have all these load development rituals where we pretend we can get by with less data.
I'm not a statistician - I'm only an engineer, but I've taken several statistics courses, and I utilize statistics on a daily basis. I would completely agree with the folks that are pushing to have statistically significant data sets in order to 'report' a statistical figure. Frankly, shooting 3 or 5 rounds to establish SD/ES is an effort of vanity.
I think the relatively recent push to use ES as a standard figure is more a function of folks having very small data sets, so an ES starts to become more representative of an SD figure. Without knowing it, there may be a lot of people that could be correcting their own poor practices by looking at the wrong figure, haha.
I keep seeing that "Perverse Nature of of Standard Deviation" referenced in these types of threads. That paper really falls apart in the first page where he says that small data sets can reliably convert ES to SD based on simply multiplying a coefficient. There are way too many assumptions made to take that approach, and I can't imagine trying to stand behind any sort of technical design/report/analysis using that method.....in fact I might loose my job if I used that level of judgement. He uses dataset examples consisting of 2 to 7 data points. Performing any sort of statistical analysis on two data points is just a really bad recommendation....in fact it runs contrary to how statistical methods should be employed. His credibility took a nose dive for me anyways.
I'm digging the level of conversation by the members here though!
So an aggregate of of all 40-50 shot over several outings - will most likely be inflated over 40-50 shots during one out, but again, may have more real-world relevance?You can’t just average SDs, you have to have the original data (if you have ten shots with velocity 2499-2501 and ten with velocity 2999-3001, the SD of each group would be close to zero, but the SD of the twenty together would be very high).
The really problem is that often we don’t want to measure a significant number. Imagine doing load development and having to measure 25 shots from each charge weight and seating depth, maybe different neck tensions, powders, bullets. You would burn out the barrel. So we have all these load development rituals where we pretend we can get by with less data.
The method he suggests in the article about getting your SD by using your ES divided by a certain number in the chart ( coefficient?). Did anyone else see his example is wrong or is my math screwed up? He said it was 15.04 using his chart it should be 18.05
(3002-2960)/2.326=18.05
He says five shots at 2960, 3002, 2982, 2976, 2981
(3002-2960)/2.326=18.05
He says five shots at 2960, 3002, 2982, 2976, 2981
Last edited:
I don’t think that’s really a valid method to be honest. When I said above the paper looked decent I didn’t notice that, I was referring to his criticism of measuring SDs of very small groups.The method he suggests in the article about getting your SD by using your ES divided by a certain number in the chart ( coefficient?). Did anyone else see his example is wrong or is my math screwed up? He said it was 15.04 using his chart it should be 18.05
(3002-2960)/2.326=18.05
He says five shots at 2960, 3002, 2982, 2976, 2981
I have come to the conclusion that some people just refuse to try to understand the math behind something. We really shouldn't be measuring group sizes with ES either, it is a bit more difficult but we have apps that should be able to tell you the SD of the distance of each bullet impact from the center of the group.Performing any sort of statistical analysis on two data points is just a really bad recommendation....in fact it runs contrary to how statistical methods should be employed.
I think people gravitate to ES over SD as far as muzzle velocity is concerned because they use a small sample size and when compared to a legit sample size, their ES is smaller so it gives them more bragging rights. If you have a legit sample size, you can exclude the upper 2.5% and lower 2.5% and the ES should be 4 times the SD. I don't get why people just dismiss the standard deviation being 68% of the data points falling between +-1 SD and 95% of the data points falling between +-2 SD. When you count all 79 shots from my set you get "SD: 4.12, ES: 19"
My total set is:
2805, 2805, 2805, 2805, 2806, 2806, 2807, 2807, 2807, 2807, 2808, 2808, 2808, 2808, 2809, 2809, 2809, 2809, 2810, 2810, 2810, 2811, 2811, 2811, 2812, 2812, 2812, 2812, 2812, 2812, 2813, 2813, 2813, 2813, 2813, 2813, 2813, 2813, 2813, 2813, 2814, 2814, 2814, 2814, 2814, 2814, 2814, 2814, 2814, 2815, 2815, 2815, 2815, 2815, 2815, 2815, 2815, 2815, 2815, 2815, 2816, 2816, 2816, 2816, 2816, 2816, 2816, 2816, 2817, 2817, 2818, 2818, 2818, 2819, 2819, 2819, 2822, 2822, 2824
If we remove the top and bottom 2 data points (1.975 but I am rounding to 2, although in this case the value doesn't change since we are only excluding 2824 {removed two 2805's still leaves us with a min of 2805 and removing 2824 and one of the 2822, we still have a max of 2822} ), we get an ES of 17 (Expected being 4.12 * 4 = 16.48). Now compare that to an example from this thread: "SD 4.3, ES 12". If your ES is less then 3 times your SD, you don't have enough data points AKA you have low as fuck confidence level.
People say shit like "I use ES because that one high or low velocity will cause me to drop a point." Like OK bro, you keep on spitting in the face of mathematics and trick yourself into believing that powder charge A with SD of 4 and ES of 12 is better then powder charge B with SD of 4 and ES of 20.
What do you mean. If you give me a set of numbers I can give you the stats including confidence intervals for the set.If you dont mind sharing, what is the difference in ES/SD at 5 shots, 10 shots, and all shots?
What do you mean. If you give me a set of numbers I can give you the stats including confidence intervals for the set.
I thought you shot a long string to pull data from. Just wondering how far off exactly it would have been. At 5 and 10 vs 50+.
I think he means as a progression through your sample. Like if you stopped at 5 and calculated the SD, then again at 10, and you've already given the final SD of 4.5fps.
And to his point, if a population has a small variance, the ES/SD numbers will generally be small throughout. This works one way and not the other, though.
1 way:
A large sample size (we'll call it a population) has a small ES/SD throughout. Okay, then it stands to reason that a smaller sample of that population will also have small ES/SD.
The other way:
A small sample size has extremely low ES/SD. This does NOT necessarily mean that the population will have a small ES/SD. Just because you roll a die and get 5x 1's in a row does not mean that you will roll a 1 every time, nor even the majority of the time. As we know, a non-loaded die will roll a 1, 16.667% of the time.
To reiterate, however, if you roll a loaded die 1000 times and get 985 1's and 15 2's, it can be expected to roll a bunch of 1's for a sample size of 5.
Hopefully that makes sense. From the graph that I posted, the orange line (23.7gr Varget) had a SD of between 6-7.6 fps for 8 shots. However, over a 35 shot sample it grew to be effectively tied for the worst overall SD of the loads I tested. And in complete transparency, 35 is still a small sample size in the grand scheme of statistical analysis. According to many I know that do such analysis regularly, it's about the bare minimum for most applications to base any sort of judgement on at all.
ETA: to go a little further, it also depends on the variance of the population how many samples are needed to draw conclusions. Populations with low variance (small SD) will show consistent results sooner than those with large variance (high SD). Nonetheless, basing it off of 5-10 samples is still a high risk of getting hosed by an unlucky string of "good" numbers out of a population with high variance. This is where confidence intervals come into play and it's been long enough since I've done one that I'll admit that I don't fully remember how they work. I'm sure Raining or someone else can expand. My understanding is, however, that the more samples you go through and maintain those good numbers, the more confidence you can have that your samples represent the population accurately.
Last edited:
And SD of 4 isn't actually an SD of 4, it is an SD of 4 with X% confidence of being between [X and Y]. You can end up with the correct conclusion with a confidence of 10%, approximately 10% of the time...I thought you shot a long string to pull data from. Just wondering how far off exactly it would have been. At 5 and 10 vs 50+.
Edit: I gave examples of actual values earlier in the thread with different confidence % and SD values and sample sizes.
I always try to explain the underlying statistics to shooters and their eyes roll up into their heads. There is something to be said about a statistically representative sample size.This topic came up in another post in the range reports section. The moral of the story is that if you're using any sort of analysis on a sample size of less than 20-25, you're lying to yourself.
This is .223 data with 5 different charge weights every .2 grains from 23.5-24.3 of Varget. Sorry for not labeling well; it was originally only for personal use. On the left side is SD in fps, on the bottom is the number of samples. It represents a running SD as the number of shots/samples increases over 30-35 rounds.
View attachment 7258249
If you look at the data from 5 shots it's a complete lie. If you look at the data at 10 shots it's a lie. From 20-30 shots you're kinda getting an idea, and IMHO I should have taken this to 50 shots because I think it would tell me that changing charge weight really doesn't change SD appreciably at all.
Most notably, follow the dark blue and orange lines as sample size increases and think about how your perception of a load would be at 5, 10, 15, 20, etc.. shot sample sizes...
Now with that said, most of these ended up hovering around 20fps. Another rifle (6 creed) I shot a 30 shot sample and it was at 12.5fps SD after 30.
From what I have seen so far I would say a TRUE SD of between 10-15fps is excellent. Any 5-10 shot sampling is a waste of your time, other than potentially grabbing a quick average velocity to plug into your calculator. However, even average velocity bounces around and settles out after 20 samples, too.
ES is also a funny topic because you have two data points that you are looking at regardless of the sample size. Not really metric that I would use to draw conclusions about consistency of my ammo
I think he means as a progression through your sample. Like if you stopped at 5 and calculated the SD, then again at 10, and you've already given the final SD of 4.5fps.
And to his point, if a population has a small variance, the ES/SD numbers will generally be small throughout. This works one way and not the other, though.
1 way:
A large sample size (we'll call it a population) has a small ES/SD throughout. Okay, then it stands to reason that a smaller sample of that population will also have small ES/SD.
The other way:
A small sample size has extremely low ES/SD. This does NOT necessarily mean that the population will have a small ES/SD. Just because you roll a die and get 5x 1's in a row does not mean that you will roll a 1 every time, nor even the majority of the time. As we know, a non-loaded die will roll a 1, 16.667% of the time.
To reiterate, however, if you roll a loaded die 1000 times and get 985 1's and 15 2's, it can be expected to roll a bunch of 1's for a sample size of 5.
Hopefully that makes sense. From the graph that I posted, the orange line (23.7gr Varget) had a SD of between 6-7.6 fps for 8 shots. However, over a 35 shot sample it grew to be effectively tied for the worst overall SD of the loads I tested. And in complete transparency, 35 is still a small sample size in the grand scheme of statistical analysis. According to many I know that do such analysis regularly, it's about the bare minimum for most applications to base any sort of judgement on at all.
ETA: to go a little further, it also depends on the variance of the population how many samples are needed to draw conclusions. Populations with low variance (small SD) will show consistent results sooner than those with large variance (high SD). Nonetheless, basing it off of 5-10 samples is still a high risk of getting hosed by an unlucky string of "good" numbers out of a population with high variance. This is where confidence intervals come into play and it's been long enough since I've done one that I'll admit that I don't fully remember how they work. I'm sure Raining or someone else can expand. My understanding is, however, that the more samples you go through and maintain those good numbers, the more confidence you can have that your samples represent the population accurately.
If I understand this post and one of your previous graphs correctly, you don't believe that the specific load has an effect on the sd. In other words, load X that starts with an SD of 4 for the first 10rnds, and load Z that starts at 20sd will both eventually end up at 25sd if you simply shoot enough rounds?
6.5 Creedmoor
9 shot string (only had 9 bullets left before a match)
SD 6.2 ES 19
2811 FPS average.
9 shot string (only had 9 bullets left before a match)
SD 6.2 ES 19
2811 FPS average.
If I understand this post and one of your previous graphs correctly, you don't believe that the specific load has an effect on the sd. In other words, load X that starts with an SD of 4 for the first 10rnds, and load Z that starts at 20sd will both eventually end up at 25sd if you simply shoot enough rounds?
In the case of that particular rifle with that bullet loaded with Varget from 23.5-24.3gr, it appears that the variance will converge as the sample size increases. It's speculation at this point but yeah, 5x of 35 samples each all kind of point towards charge weight not really playing a part in SD for that particular setup. I have seen other tests conducted by myself and others that were in the 30-50 shot or larger sample size that tested powder charge and seating depth, and everything I've seen points towards the SD's leveling out to within 2-4fps of each other in the long run. I'm not claiming that happens every time-- I'm still looking for the knobs to turn that will make it better or worse. That said, so far I haven't seen anything drastic with switching primers, powder charge, nor seating depth. It could also just be that the factory barrel on that rifle isn't capable of showing me the differences that would be present in a higher quality barrel, chamber, etc...
I intend to do some more testing with that barrel in the future, but I bought that particular rifle just for the action & stock to build a .30 cal subsonic rifle to test out some other theories (a whole different topic) and figured since I didn't care about the .223 barrel I'd shoot a couple hundred rounds to break it in, then test out my curiosity about larg(er) sample sizes with some components that have been sitting on a shelf for quite a while. Anyway, I got my barrel and reamer in for the other project, so I'm going to pursue the subsonic stuff with that action first.
In the mean time I have a couple of 6 & 6.5mm creed barrels that I'm going to do similar testing with (probably 6.5 mostly, for the barrel life aspect). Maybe over the next few weeks as life/weather permits.
There is some good info on this subject on the Autotrickler site in the blog section.

Practical statistics for shooters
How many shots do you need to fire? How do you know if a result was just random luck? Have you given up on testing because it's too hard to make an improvement? All of these questions have answers....
www.autotrickler.com

Just shoot paper at distance and see how well it shoots for yourself.
That's what a lot of benchrest shooters do. They do not even know their SD or ES of their velocities, hell, a lot of them couldn't even tell you what velocity their projectile is at when it leaves the barrel.
They shoot paper at distance and use the charge that shows the smallest vertical dispersion. Positive compensation. Works great if you are primarily shooting at one set distance (say 1,000 yard benchrest).
However, when shooting at varying distances, everywhere from 100 yards to 1,000+ yards, having consistent and predictable velocities makes for better data input for our ballistics software (or hard date DOPE), and thus better data outputs. I know you know this though.
I'm loving the conversation on this. In general there seems to be a lot of misconceptions and lack of knowledge about statistics, data reliability and the importance of sample sizes in the shooting community.
I think last night on Instagram I saw 3 pictures of chrono results, all from different people, and they were all either 3 or 5 rounds. Sure made for good vanity shots, but almost statistically meaningless.
While we are on the topic of sample sizes for statistical reliability, I've found doing load development with the "Satterlee method" is pretty much useless. Heard about it on a 6.5 guys video, a lot of people were talking it up and making it sound like it was a great method for load development - bonus was it was relatively quick and simple, making it a compelling option for lots of people. I used the method for about ~2 years. At some point, for shits and giggles, I decided to load two identical ladders and shoot them back to back. Guess what? The so-called velocity node that the method was supposed to find was different between the two identical ladders! I repeated this over numerous occasions whenever shooting ladders, and the results never matched. Through more trial and error I discovered that loads that I developed within the supposed "nodes" or velocity flat spots never actually produced the lowest ES/SD. Needless to say I don't use the "Satterlee method" anymore, I only use ladders for finding pressure and getting a general idea of velocity per powder charge.
Sample size matters. I think if my college statistics teacher heard I was using the methodology lined out in the "satterlee method" to try and produce the most velocity stable loads, he would bitch slap the shit out of me. It was an interesting experiment though.
Last edited:
I'm loving the conversation on this. In general there seems to be a lot of misconceptions and lack of knowledge about statistics, data reliability and the importance of sample sizes in the shooting community.
I think last night on Instagram I saw 3 pictures of chrono results, all from different people, and they were all either 3 or 5 rounds. Sure made for good vanity shots, but almost statistically meaningless.
While we are on the topic of sample sizes for statistical reliability, I've found doing load development with the "Satterlee method" is pretty much useless. Heard about it on a 6.5 guys video, a lot of people were talking it up and making it sound like it was a great method for load development - bonus was it was relatively quick and simple, making it a compelling option for lots of people. I used the method for about ~2 years. At some point, for shits and giggles, I decided to load two identical ladders and shoot them back to back. Guess what? The so-called velocity node that the method was supposed to find was different between the two identical ladders! I repeated this over numerous occasions whenever shooting ladders, and the results never matched. Through more trial and error I discovered that loads that I developed within the supposed "nodes" or velocity flat spots never actually produced the lowest ES/SD.
Sample size matters. I think if my college statistics teacher heard I was using the methodology lined out in the "satterlee method" to try and produce the most velocity stable loads, he would bitch slap the shit out of me. It was an interesting experiment though.
I actually stumbled on the “satterlee method” way before it was a thing on the internet by loading a single case over and over in ascending powder charges to find a maximum load. I found certain areas where velocities would remain somewhat flat, and those tended to be pretty stable nodes for me, and less sensitive to temperature change. I always tested those “nodes” first to see if it would also be accurate, because who doesn’t want accuracy and the lowest temp sensitivity. A lot of times it would in fact produce great results, other times it wouldn’t.
I also bought a barrel pressure testing system and have plotted actual pressure curves from my own barrels and ammo. If you want to really geek out with data, this is the holy grail...
Same story. I noticed flat spots in the velocity and sd of a 700yd OCW test shortly after the LabRadar was released and I bought one. They have almost always lined up with the group that shoots best. I've repeated it dozens of times since then.
It's probably all statistically irrelevant though, since my sample size is to small to mean anything........
P.S. that was sarcasm........
I never understood logically how the Satterlee method could be construed as accurate. I understand the premise, but knowing that we shoot an average speed based on a particular charge weight which is the result of an average based on ES, and then selecting a load on a sample size of 1, just didn’t compute for me. As “kthomas” stated, he got different results when doing the same test twice. While the Satterlee method or variances of it have worked for others, the Newberry OCW method has been repeatable for me. I’ve test it several times against itself and the results always given me the same optimum charge weight. Maybe it’s coincidence this occurred but I do have more confidence in his method than others I’ve tried that are based on just 1 round at a given charge weight.
i drove myself crazy chasing this low ES-SD thing for over a year...i shot entire prone matches with a magneto speed attached to an MPA RAT adapter on an MPA chassis to the spigot and no matter what i did i ALWAYS end up between 20 and 30FPS over a 40 to 60 shot sample..ive taken the higher ES and lower ES cases marked them and shot them again over the MS and the numbers were not the same as the time before.
i shot a 6.5x47 that produced several 5 shot 0-ES groups and a few 10 shot groups at 1 and 2FPS but always ended at 20-30fps...this shit drove me crazy...i stopped worrying about ESs and SDs and 1-2 kernels under or over or .001 difference in seating or the perfect shoulder bump ECT because at the end of the day EVERY barrel ive shot ends up between 20-30fps no matter what i do.
i shot a 6.5x47 that produced several 5 shot 0-ES groups and a few 10 shot groups at 1 and 2FPS but always ended at 20-30fps...this shit drove me crazy...i stopped worrying about ESs and SDs and 1-2 kernels under or over or .001 difference in seating or the perfect shoulder bump ECT because at the end of the day EVERY barrel ive shot ends up between 20-30fps no matter what i do.
I never understood logically how the Satterlee method could be construed as accurate. I understand the premise, but knowing that we shoot an average speed based on a particular charge weight which is the result of an average based on ES, and then selecting a load on a sample size of 1, just didn’t compute for me. As “kthomas” stated, he got different results when doing the same test twice. While the Satterlee method or variances of it have worked for others, the Newberry OCW method has been repeatable for me. I’ve test it several times against itself and the results always given me the same optimum charge weight. Maybe it’s coincidence this occurred but I do have more confidence in his method than others I’ve tried that are based on just 1 round at a given charge weight.
Same story with the 1 shot per charge Satterly. Pretty much useless. Just normal dispersion can create flat spots that aren't there, or mask ones that are. I basically combined the Satterly theory with an OCW test. With 3 or 5rnd per charge samples you can start to see meaningful patterns in velocity. I started this all at least a year before I'd heard it called a "Satterly" and it's worked well for me.
Unfortunately the cone of fire of a rifle is also a normal distribution and is subject to the same issues as muzzle velocity tests.Just shoot paper at distance and see how well it shoots for yourself.
Edit: But I do agree on letting the paper tell the story, just with a larger sample size.
You can lead a horse to water but you can't make him drink.Same story. I noticed flat spots in the velocity and sd of a 700yd OCW test shortly after the LabRadar was released and I bought one. They have almost always lined up with the group that shoots best. I've repeated it dozens of times since then.
It's probably all statistically irrelevant though, since my sample size is to small to mean anything........
P.S. that was sarcasm........
It is OK. The other thing most people don’t want to face is that none of this matters for positional shooting. You don’t need a .25 MOA rifle and you don’t need an SD of 5. You won’t be able to see the difference. That’s why people can lie to themselves about three shot groups on paper and five shot SDs—a match isn’t going to tell them otherwise.You can lead a horse to water but you can't make him drink.
it's a little unfair to say it doesnt matterIt is OK. The other thing most people don’t want to face is that none of this matters for positional shooting. You don’t need a .25 MOA rifle and you don’t need an SD of 5. You won’t be able to see the difference. That’s why people can lie to themselves about three shot groups on paper and five shot SDs—a match isn’t going to tell them otherwise.
.25 moa rifle with 1 moa wobble = 1.25moa and on target
.75 moa rifle with 1moa wobble = 1.75moa and maybe not on target anymore
so now, when i hit that left edge of of a 6" target at 400y, is it because i didnt have a perfect wind call, or was my wind call perfect and my rifle is .5moa less precise than it could be
real world example. new 6XC barrel. old 6XC ammo. shot in the .3-.4moa area at 100y with a 5 shot SD of 3.2. took it to 500y and it shot in the .3-.4moa with similar velocity SD at the target. not even gonna touch the load. could it be better maybe, but why mess with it
ive PM'd Led from seeing this graph in the other thread he mentioned
ive been working on similar data for the past few months with the chrono numbers and on accuracy side of things
its early, but i imagine most would stroke out hearing some the common occurrences we've seen
ive been working on similar data for the past few months with the chrono numbers and on accuracy side of things
its early, but i imagine most would stroke out hearing some the common occurrences we've seen
I suppose the proper way to look at is that it will matter less percentage wise but will still matter some BUT you as a shooter need to decide if your time is better spent shrinking a .65 MOA rifle to .45 or to go out and learn to read the wind/practice positional shooting with that .65 MOA rifle.it's a little unfair to say it doesnt matter
.25 moa rifle with 1 moa wobble = 1.25moa and on target
.75 moa rifle with 1moa wobble = 1.75moa and maybe not on target anymore
so now, when i hit that left edge of of a 6" target at 400y, is it because i didnt have a perfect wind call, or was my wind call perfect and my rifle is .5moa less precise than it could be
real world example. new 6XC barrel. old 6XC ammo. shot in the .3-.4moa area at 100y with a 5 shot SD of 3.2. took it to 500y and it shot in the .3-.4moa with similar velocity SD at the target. not even gonna touch the load. could it be better maybe, but why mess with it
right.I suppose the proper way to look at is that it will matter less percentage wise but will still matter some BUT you as a shooter need to decide if your time is better spent shrinking a .65 MOA rifle to .45 or to go out and learn to read the wind/practice positional shooting with that .65 MOA rifle.
time and money better spent going from .65 to .45 with your reloads or 1.5moa to .75moa wobble, or 5mph to 2mph wind reading skills
right.
time and money better spent going from .65 to .45 with your reloads or 1.5moa to .75moa wobble, or 5mph to 2mph wind reading skills
Since the thread is titled "PRS/ELR", let's keep things in perspective. For PRS, some things matter more than others. In ELR (1500 yards and beyond, especially 1+ mile/s), it ALL matters.
I will add that my personal belief is that having the best rifle and ammunition does little if you can't make a wind call.
My SD with my pet load is something between 5 and 12, but the bullets touch at 100 and are still sub-MOA and velocity trued out to 700, so I stopped caring about the statistics and just make/shoot.
I was chasing the low SD/ES dragon for years and git tired of it. Now my ammo is definitely "good enough" for everything I would want it for.
I was chasing the low SD/ES dragon for years and git tired of it. Now my ammo is definitely "good enough" for everything I would want it for.
Well, life is unfair!it's a little unfair to say it doesnt matter
.25 moa rifle with 1 moa wobble = 1.25moa and on target
.75 moa rifle with 1moa wobble = 1.75moa and maybe not on target anymore
so now, when i hit that left edge of of a 6" target at 400y, is it because i didnt have a perfect wind call, or was my wind call perfect and my rifle is .5moa less precise than it could be
real world example. new 6XC barrel. old 6XC ammo. shot in the .3-.4moa area at 100y with a 5 shot SD of 3.2. took it to 500y and it shot in the .3-.4moa with similar velocity SD at the target. not even gonna touch the load. could it be better maybe, but why mess with it
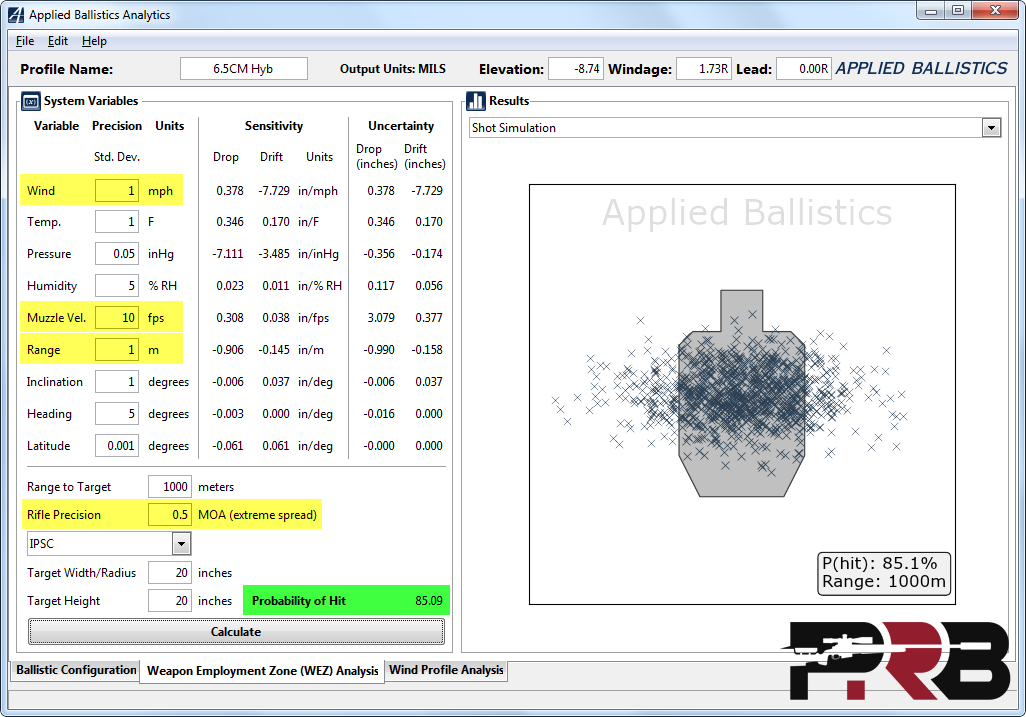
The problem with your example is that's not really how accuracy works. First of all, you can't add error, it's closer to being the root mean squared. On the other hand a ".75 MOA rifle" is not one that has an equal probability of landing a shot anywhere within a .75 MOA circle around the POA. It is really more like a cloud of potential locations that gets denser toward the middle (see the image below from an Applied Ballistics simulation). So in your example, you have 1 MOA of wobble, and .25 vs .75 of inherent error in the rifle and ammo. A better approximation is that 95% of the shots will land in a 1.25 MOA circle vs a 1.03 MOA circle. And since most of those are still going to be tighter, it will be pretty rare to have a miss just due to the inherent accuracy.
See here for more detail:
How Much Does Group Size Matter?
As long-range shooters, we tend to obsess over every little detail. We think everything is important...

Unfortunately the cone of fire of a rifle is also a normal distribution and is subject to the same issues as muzzle velocity tests.
Edit: But I do agree on letting the paper tell the story, just with a larger sample size.
That's the biggest missing piece of my data collection so far. By plugging 30 rounds into 1 group all I see is the outside edge, which doesn't show the story well. I have a 1.2" group that looks more scattered than a 1.6" group because of 2-3 shots that went way out. I think from now on I'll be shooting multiple 5-shot groups and find a way to compile them to get the radius of each shot from the composite group center.
yay ballistic xThat's the biggest missing piece of my data collection so far. By plugging 30 rounds into 1 group all I see is the outside edge, which doesn't show the story well. I have a 1.2" group that looks more scattered than a 1.6" group because of 2-3 shots that went way out. I think from now on I'll be shooting multiple 5-shot groups and find a way to compile them to get the radius of each shot from the composite group center.
Math is funWell, life is unfair!
The problem with your example is that's not really how accuracy works. First of all, you can't add error, it's closer to being the root mean squared. On the other hand a ".75 MOA rifle" is not one that has an equal probability of landing a shot anywhere within a .75 MOA circle around the POA. It is really more like a cloud of potential locations that gets denser toward the middle (see the image below from an Applied Ballistics simulation). So in your example, you have 1 MOA of wobble, and .25 vs .75 of inherent error in the rifle and ammo. A better approximation is that 95% of the shots will land in a 1.25 MOA circle vs a 1.03 MOA circle. And since most of those are still going to be tighter, it will be pretty rare to have a miss just due to the inherent accuracy.
See here for more detail:
How Much Does Group Size Matter?
As long-range shooters, we tend to obsess over every little detail. We think everything is important...precisionrifleblog.com
Yea, for close range you will need to get creative or get one of those fancy electronic targets.That's the biggest missing piece of my data collection so far. By plugging 30 rounds into 1 group all I see is the outside edge, which doesn't show the story well. I have a 1.2" group that looks more scattered than a 1.6" group because of 2-3 shots that went way out. I think from now on I'll be shooting multiple 5-shot groups and find a way to compile them to get the radius of each shot from the composite group center.
Same story with the 1 shot per charge Satterly. Pretty much useless. Just normal dispersion can create flat spots that aren't there, or mask ones that are. I basically combined the Satterly theory with an OCW test. With 3 or 5rnd per charge samples you can start to see meaningful patterns in velocity. I started this all at least a year before I'd heard it called a "Satterly" and it's worked well for me.
I do something similar.
I work up a ladder, just so I have an idea on velocities as well as were pressure starts. From there I will load up ammo in groups of 5 rounds, in around the area for where I want to be velocity wise and safe from pressure. Those 5 rounds of each charge will provide a lot better idea of any sort of velocity stability ("node"), then the one shot per charge ladder.
This has produced good results for me. Generally my ES hovers in the ~15-20 fps range with an SD of ~5 over 10+ shots. Going off of a so called "node" from the ladder in the "Satterlee method" has never produced the lowest ES/SD ammo for me. As you say, those velocity flat spots with the one charge ladder are misleading.
This is my approach as well (though I dont claim to be anymore than an a novice load developer). Its very interesting when you lay a single line down vs several on the graph. Suffice it to say, it seems the true Saterlee is a 50/50 crapshoot at best.I do something similar.
I work up a ladder, just so I have an idea on velocities as well as were pressure starts. From there I will load up ammo in groups of 5 rounds, in around the area for where I want to be velocity wise and safe from pressure. Those 5 rounds of each charge will provide a lot better idea of any sort of velocity stability ("node"), then the one shot per charge ladder.
This has produced good results for me. Generally my ES hovers in the ~15-20 fps range with an SD of ~5 over 10+ shots. Going off of a so called "node" from the ladder in the "Satterlee method" has never produced the lowest ES/SD ammo for me. As you say, those velocity flat spots with the one charge ladder are misleading.
On a similar statistical sample size note, the Nosler RDF bullets taught me that you can't trust 3 shot groups for shit  .
.
I used to test bullet seating depth with just 3 rounds per, which worked good enough for me at the time with more consistent bullets such as Berger Hybrids, but I was pulling my hair with RDF's.
I would shoot some of the smallest 3 round groups with the RDF's when doing load development, thinking I had an amazing one hole load worked up for my gun. Load up a bunch of rounds with the "winning" depth from the bullet seating depth, and I would be frustrated to find out that I actually had ammo that would be lucky to break 1 moa for 5 round groups
I could never crack the RDF nut. Happily went back to Berger's after that short failed experiment. It certainly taught me something though.
.I used to test bullet seating depth with just 3 rounds per, which worked good enough for me at the time with more consistent bullets such as Berger Hybrids, but I was pulling my hair with RDF's.
I would shoot some of the smallest 3 round groups with the RDF's when doing load development, thinking I had an amazing one hole load worked up for my gun. Load up a bunch of rounds with the "winning" depth from the bullet seating depth, and I would be frustrated to find out that I actually had ammo that would be lucky to break 1 moa for 5 round groups
I could never crack the RDF nut. Happily went back to Berger's after that short failed experiment. It certainly taught me something though.
Similar threads
- Replies
- 4
- Views
- 1K
- Replies
- 7
- Views
- 481