You just need adobe reader. It's free and you probably already have it.Is there a specific editor to use?
Join the Hide community
Get access to live stream, lessons, the post exchange, and chat with other snipers.
Register
Download Gravity Ballistics
Get help to accurately calculate and scope your sniper rifle using real shooting data.

Install the app
How to install the app on iOS
Follow along with the video below to see how to install our site as a web app on your home screen.
Note: This feature may not be available in some browsers.
You are using an out of date browser. It may not display this or other websites correctly.
You should upgrade or use an alternative browser.
You should upgrade or use an alternative browser.
Advanced Marksmanship Data Book and Charts - Dope - Wind Rose - Weaponized Math - MOA to Mil - Jack Master
- Thread starter Jack Master
- Start date
Anyone interested in a Mover speed and Lead charts?
Here are my charts to measure the mover speed and what to hold for speed at distance. The mover speed chart can be used for any mover/rifle. The lead chart is rifle specific and based on time of flight. IF things are moving faster than 5mph you'll have to do multiples of a number.


Here are my charts to measure the mover speed and what to hold for speed at distance. The mover speed chart can be used for any mover/rifle. The lead chart is rifle specific and based on time of flight. IF things are moving faster than 5mph you'll have to do multiples of a number.
Attachments
Been listening to the podcast and was intrigued—thank you for developing and sharing the info.
So was mine. I thinned it out. It was getting ridiculous.My data book is now the size of a 1965 Webster’s Dictionary.
How do you have a paper chart for Density Altitude (DA) changes in your dope? Do any of you have a DA sheet in your Data Book?
I have read and been told to have drop charts for every 2000DA change. My home range is usually around 2000DA. This means I need a drop chart for -2000ft, 0ft, 2000ft, 4000ft, 6000ft, 8000ft, 10,000ft. That's 7 pages in a dope book for one rifle. I don't really want to have that many pages for one rifle (yes, I want ONE data Book for all my rifles). With 3 rifles is 21 pages to sift through. So... below is the chart I made for changing DA. Now I have 2 pages, my Home range dope chart with the wind information on the back and a DA dope chart.
Things to Note
Let me know what you think.
1st chart Raw DA values

2nd chart - Difference in DA from my home range.

I have read and been told to have drop charts for every 2000DA change. My home range is usually around 2000DA. This means I need a drop chart for -2000ft, 0ft, 2000ft, 4000ft, 6000ft, 8000ft, 10,000ft. That's 7 pages in a dope book for one rifle. I don't really want to have that many pages for one rifle (yes, I want ONE data Book for all my rifles). With 3 rifles is 21 pages to sift through. So... below is the chart I made for changing DA. Now I have 2 pages, my Home range dope chart with the wind information on the back and a DA dope chart.
Things to Note
- Data recorded - at the top of the chart is how I got the DA numbers. This way I can reference how temperature might change the DA as well as the station pressure. (note the comment in the margin about how temp change = DA change)
- All of these are at 50% humidity. To keep this simple I had to eliminate a variable, humidity was it. While I think it will effect things more after 1000yds I don't think it has enough variance inside 1000 to worry about.
- Wind - The wind row has 2 numbers in it. The 2 numbers are the wind speeds that are equivalent to the wind hold for 2000DA. Example - if I'm shooting at 6000DA, 800 yards - a 7mph hold is 0.9 mils (6mph from 2000DA) and a 12mph hold is 1.6mil (10mph hold for 2000DA) this allowed the chart to re-use 2 columns of information for each DA change and for me to know what my Rifle MPH is at each DA.
- After doing this I think the chart will work out to 1000 or 1100 yards. After that a more refined DA chart may be warranted. At 1100 yards jumping 2000DA is a 0.4 mil jump, that's about 16" of change. For an accurate shot I recommend consulting your Ballistic program on the longer shots with changing DA, but these values will at least give you a starting point if you don't have any other information. of you'll need to pin down your true DA and guess between numbers if needed.
- I presented this chart in 2 ways. 1st - straight data. 2nd is the plus or minus from the home range value. Doing the 2nd version can help us understand how much DA can really effect our dope. The 2nd if more for informational used and not necessarily something I would have in my data book.
Let me know what you think.
1st chart Raw DA values
2nd chart - Difference in DA from my home range.
Last edited:
@Jack Master Used your weaponized math chart this weekend at the Treadproof class. Great resource. Thanks again.
Do you have versions for the various phases of the moon's effect on drop? 
THIS IS AWESOME...just noticed this.
Thank you very much.
THIS IS AWESOME...just noticed this.
Thank you very much.
Thanks blade. I didn't invent the idea. It's Marc's hard work, I just put it in a chart.@Jack Master Used your weaponized math chart this weekend at the Treadproof class. Great resource. Thanks again.
Do you have versions for the various phases of the moon's effect on drop?
THIS IS AWESOME...just noticed this.
Thank you very much.
Wait... I need a chart for that? I'll do some research!... haha
Thanks
I get it. Marc’s formulas were dead nuts. But the chart makes it flow that much faster.Thanks blade. I didn't invent the idea. It's Marc's hard work, I just put it in a chart.
You guys make a great team! Many thanks...Thanks blade. I didn't invent the idea. It's Marc's hard work, I just put it in a chart.
I’m a little confused. In the wind column, what does 5/9, 6/11...... represent? Is that wind speed or direction?How do you have a paper chart for Density Altitude (DA) changes in your dope? Do any of you have a DA sheet in your Data Book?
I have read and been told to have drop charts for every 2000DA change. My home range is usually around 2000DA. This means I need a drop chart for -2000ft, 0ft, 2000ft, 4000ft, 6000ft, 8000ft, 10,000ft. That's 7 pages in a dope book for one rifle. I don't really want to have that many pages for one rifle (yes, I want ONE data Book for all my rifles). With 3 rifles is 21 pages to sift through. So... below is the chart I made for changing DA. Now I have 2 pages, my Home range dope chart with the wind information on the back and a DA dope chart.
Things to Note
- Data recorded - at the top of the chart is how I got the DA numbers. This way I can reference how temperature might change the DA as well as the station pressure. (note the comment in the margin about how temp change = DA change)
- All of these are at 50% humidity. To keep this simple I had to eliminate a variable, humidity was it. While I think it will effect things more after 1000yds I don't think it has enough variance inside 1000 to worry about.
- Wind - The wind row has 2 numbers in it. The 2 numbers are the wind speeds that are equivalent to the wind hold for 2000DA. Example - if I'm shooting at 6000DA, 800 yards - a 7mph hold is 0.9 mils (6mph from 2000DA) and a 12mph hold is 1.6mil (10mph hold for 2000DA) this allowed the chart to re-use 2 columns of information for each DA change and for me to know what my Rifle MPH is at each DA.
- After doing this I think the chart will work out to 1000 or 1100 yards. After that a more refined DA chart may be warranted. At 1100 yards jumping 2000DA is a 0.4 mil jump, that's about 16" of change. For an accurate shot I recommend consulting your Ballistic program on the longer shots with changing DA, but these values will at least give you a starting point if you don't have any other information. of you'll need to pin down your true DA and guess between numbers if needed.
- I presented this chart in 2 ways. 1st - straight data. 2nd is the plus or minus from the home range value. Doing the 2nd version can help us understand how much DA can really effect our dope. The 2nd if more for informational used and not necessarily something I would have in my data book.
Let me know what you think.
1st chart Raw DA values
View attachment 7172626
2nd chart - Difference in DA from my home range.
View attachment 7172627
I’m a little confused. In the wind column, what does 5/9, 6/11...... represent? Is that wind speed or direction?
Always wind speed 90 degrees to my bullet travel. Here is number 3 from the wright-up that explains what those numbers do.
Wind - The wind row has 2 numbers in it. The 2 numbers are the wind speeds that are equivalent to the wind hold for 2000DA. Example - if I'm shooting at 6000DA, 800 yards - a 7mph hold is 0.9 mils (6mph from 2000DA) and a 12mph hold is 1.6mil (10mph hold for 2000DA) this allowed the chart to re-use 2 columns of information for each DA change and for me to know what my Rifle MPH is at each DA.
Oh ok I see it now. It’s the equivalent at 2000 DA. It would help if I could read haha.Always wind speed 90 degrees to my bullet travel. Here is number 3 from the wright-up that explains what those numbers do.
Where can I buy just an empty binder? I just want to add the pdf in thread. Also are the pdf files already scaled to fit a data book?
Where can I buy just an empty binder? I just want to add the pdf in thread. Also are the pdf files already scaled to fit a data book?
The book cover I use is a MILITARY NOTE BOOK COVER from tactical notebook covers. I ordered a 5.5x8.5 binder from Amazon and put the two together or you could order the velcro insert that tactical notebooks carries.
MILITARY NOTE BOOK COVER from tactical notebook covers
These pages on this thread are 8 1/2 x 11 and intended to be folded in half and fit in a 5x8-ish binder I prefer to cut them out around the outline, laminate them back to back and put them in my book.
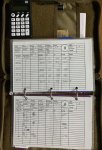
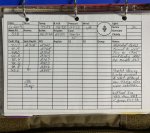
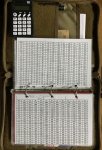
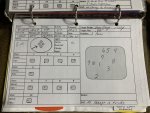
Here are some photos of my data book. @seansmd
With the wind chart on the back of each chart I can see my dope chart and the wind chart each time my book is open.
Further in the back I have paper for notes or sketching. Field charts for updating data and blank charts to right out charts if I don't have one.
I also have a milling chart laminated and instructions to program my Lisa range finder.
Book is a MILITARY NOTE BOOK COVER from tactical notebook covers
View attachment 7160736
This is an excellent post. Thank you for putting in the work on this.
@Jack Master Love what you're doing this these charts. I work with data for work so I appreciate your work here. I was making my own chart based off your work in excel and noticed something that I don't understand.
the 500 Try column for 0.9 * 1.45 comes out to 1.3 the chart has it as 1.4? is this because it's more aligned to Marc's experience or your experience or some other factor i'm not understanding. because i noticed that all the way down that column it's 0.1 different than my math. the 500 true 5.0 and 5.1 try was also 0.1 shifted from the math. there's a couple others as well.
is this trued to a specific caliber or rifle, or again am i misreading this?
please don't take this as being critical, i'm trying to understand.
No it’s because at some point there is a correction and it needs to be increased ie, rounded up. For 308 it can occur at around 600 yds. In addition rounding up is better because it’s always better to miss high than low.@Jack Master Love what you're doing this these charts. I work with data for work so I appreciate your work here. I was making my own chart based off your work in excel and noticed something that I don't understand.
the 500 Try column for 0.9 * 1.45 comes out to 1.3 the chart has it as 1.4? is this because it's more aligned to Marc's experience or your experience or some other factor i'm not understanding. because i noticed that all the way down that column it's 0.1 different than my math. the 500 true 5.0 and 5.1 try was also 0.1 shifted from the math. there's a couple others as well.
is this trued to a specific caliber or rifle, or again am i misreading this?
please don't take this as being critical, i'm trying to understand.
That's not it, I completely understand what you are saying but this is not rounding or correction. If you do it in Excel or even with just a calculator you'll see.
@Jack Master Love what you're doing this these charts. I work with data for work so I appreciate your work here. I was making my own chart based off your work in excel and noticed something that I don't understand.
the 500 Try column for 0.9 * 1.45 comes out to 1.3 the chart has it as 1.4? is this because it's more aligned to Marc's experience or your experience or some other factor i'm not understanding. because i noticed that all the way down that column it's 0.1 different than my math. the 500 true 5.0 and 5.1 try was also 0.1 shifted from the math. there's a couple others as well.
is this trued to a specific caliber or rifle, or again am i misreading this?
please don't take this as being critical, i'm trying to understand.
Rack - I agree. I too am seeing this. Thanks for pointing it out.
After spending 30 minutes thinking Google sheets can't do math and 3 beers later I finally found what's going on. Its simple, I let the spread sheet carry the decimals in the background. See image below. When the cells are set to show one number past the decimal ya don't see the rounding going on. My sheet is built from the 1.0 Mil line (in heavy boarder) with adding, subtracting and multiplying to the end line.
My Questions will be - Does it matter? After all, this is only try dope. Several guys have used this sheet a reported back that is worked really well. We're expecting the change a 10th here and there to make perfect watermark bullet placement.
EDIT: - I did replace the sheet on the first posting with an updated weaponized math. It does not carry the decimals. This would be closer to what is calculated with a standard calculator or mental math. Still don't think it'll make much real difference.
Last edited:
Thanks @Jack Master . It doesn't matter much in practice, just more of an OCD thing. When 1+1=3 my brain complains. 
Rack - I agree. I too am seeing this. Thanks for pointing it out.
After spending 30 minutes thinking Google sheets can't do math and 3 beers later I finally found what's going on. Its simple, I let the spread sheet carry the decimals in the background. See image below. When the cells are set to show one number past the decimal ya don't see the rounding going on. My sheet is built from the 1.0 Mil line (in heavy boarder) with adding, subtracting and multiplying to the end line.
My Questions will be - Does it matter? After all, this is only try dope. Several guys have used this sheet a reported back that is worked really well. We're expecting the change a 10th here and there to make perfect watermark bullet placement.
EDIT: - I did replace the sheet on the first posting with an updated weaponized math. It does not carry the decimals. This would be closer to what is calculated with a standard calculator or mental math. Still don't think it'll make much real difference.
View attachment 7181834
Thanks man, I agree, I don't think it will matter much. However if we want to truly put weaponized math to the test we want it to match the training.
Again love what you did with the math visually, and such a cool concept Marc and Frank came up with!
Awesome job with this thank you. I am trying to fill a range card out for my 22 and I cant seem to be able to adjust yardage On any of the apps that I use? Is there not a way to be able to change the yards? I'm not very computer savvy
No. The yardage are set. We did not make them editable.Awesome job with this thank you. I am trying to fill a range card out for my 22 and I cant seem to be able to adjust yardage On any of the apps that I use? Is there not a way to be able to change the yards? I'm not very computer savvy
So you would then plug in the left to right 9 mph wind into your device/app?
Yes. that is one way to do it.So you would then plug in the left to right 9 mph wind into your device/app?
But, if you'er using a device that will turn the angles for you, you could use that rather than this chart. The device will be more accurate than this chart. This chart is for quick wind speed adjustments or reading the wind without a computer to help get a good wind holds. If you have a device, and have time, use it.
For me, shooting inside 650 yards, all of my wind holds are done using this wind rose combined with the Gun "Mile per Hour" Method. Inside 650 yards I don't get out a computer of any kind for drop or wind, its all on paper. Over 650 I might start verifying my paper information with a computer.
Shoot, I didn't realize the capability of my app. Thanks!!Yes. that is one way to do it.
But, if you'er using a device that will turn the angles for you, you could use that rather than this chart. The device will be more accurate than this chart. This chart is for quick wind speed adjustments or reading the wind without a computer to help get a good wind holds. If you have a device, and have time, use it.
For me, shooting inside 650 yards, all of my wind holds are done using this wind rose combined with the Gun "Mile per Hour" Method. Inside 650 yards I don't get out a computer of any kind for drop or wind, its all on paper. Over 650 I might start verifying my paper information with a computer.
there isn't one at this time. If you could choose, what 5 speeds (KPH) would you want on the chart?Is there such thing as the corrected wind speed for angle chart in KPH for us that use metric or is there an editable version
there isn't one at this time. If you could choose, what 5 speeds (KPH) would you want on the chart?
I would probably suggest 6,12,18,24,32
Duh to me! I just recognized this.I would probably suggest 6,12,18,24,32
This chart does work in KPH. The values in the chart are not based on any unit of measure. They are based on geometry. This chart, the way it is show, will work for: MPH, KPH, meters per second, feet per hour or light-years per day. Any measure of speed can be used. The values in the the chart do not change for what is being measure. If i used 5, 10, 15, 20 and 25KPH the values in the chart would all be exactly the same as the MPH. In the example on the "How To" the 17KPH resultant will be 9KPH.
Duh to me! I just recognized this.
This chart does work in KPH. The values in the chart are not based on any unit of measure. They are based on geometry. This chart, the way it is show, will work for: MPH, KPH, meters per second, feet per hour or light-years per day. Any measure of speed can be used. The values in the the chart do not change for what is being measure. If i used 5, 10, 15, 20 and 25KPH the values in the chart would all be exactly the same as the MPH. In the example on the "How To" the 17KPH resultant will be 9KPH.
Brilliant this will be of great value to me. Thanks
Last edited:
Here are the PDF's for my above post (#96.) These can be printed on a standard sheet of paper and folded in 1/2, like in my data book above.
Attachments
Thanks again @Jack Master for putting this all together for us. Getting mine put together... Took advantage of a Black Friday deal Tactical Notebook Covers had.

Just Curious here - What Did your DOPE card look like before this one? Or if you are not using this card, what does yours look like? Post-um up. Thanks
How do you have a paper chart for Density Altitude (DA) changes in your dope? Do any of you have a DA sheet in your Data Book?
I have read and been told to have drop charts for every 2000DA change. My home range is usually around 2000DA. This means I need a drop chart for -2000ft, 0ft, 2000ft, 4000ft, 6000ft, 8000ft, 10,000ft. That's 7 pages in a dope book for one rifle. I don't really want to have that many pages for one rifle (yes, I want ONE data Book for all my rifles). With 3 rifles is 21 pages to sift through. So... below is the chart I made for changing DA. Now I have 2 pages, my Home range dope chart with the wind information on the back and a DA dope chart.
Things to Note
- Data recorded - at the top of the chart is how I got the DA numbers. This way I can reference how temperature might change the DA as well as the station pressure. (note the comment in the margin about how temp change = DA change)
- All of these are at 50% humidity. To keep this simple I had to eliminate a variable, humidity was it. While I think it will effect things more after 1000yds I don't think it has enough variance inside 1000 to worry about.
- Wind - The wind row has 2 numbers in it. The 2 numbers are the wind speeds that are equivalent to the wind hold for 2000DA. Example - if I'm shooting at 6000DA, 800 yards - a 7mph hold is 0.9 mils (6mph from 2000DA) and a 12mph hold is 1.6mil (10mph hold for 2000DA) this allowed the chart to re-use 2 columns of information for each DA change and for me to know what my Rifle MPH is at each DA.
- After doing this I think the chart will work out to 1000 or 1100 yards. After that a more refined DA chart may be warranted. At 1100 yards jumping 2000DA is a 0.4 mil jump, that's about 16" of change. For an accurate shot I recommend consulting your Ballistic program on the longer shots with changing DA, but these values will at least give you a starting point if you don't have any other information. of you'll need to pin down your true DA and guess between numbers if needed.
- I presented this chart in 2 ways. 1st - straight data. 2nd is the plus or minus from the home range value. Doing the 2nd version can help us understand how much DA can really effect our dope. The 2nd if more for informational used and not necessarily something I would have in my data book.
Let me know what you think.
1st chart Raw DA values
View attachment 7172626
2nd chart - Difference in DA from my home range.
View attachment 7172627
Let me make sure I'm understanding this right. In the second chart your 950 dope at home is 7.5 but at -2000 you would add .5 and your 6/10 wind values become 5/9? Just making sure I'm thinking right. Also 1. Do you see any need to be closer together than 2000da and 2. are your temp/pressure values observed or general. And 3. Thank You for all this.
Similar threads
- Replies
- 1
- Views
- 205
- Replies
- 5
- Views
- 884
- Replies
- 22
- Views
- 1K
- Replies
- 16
- Views
- 989

