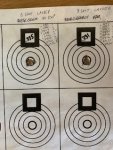
To that end, this thread went on a small tangent.
The point I was originally trying to convey was that extreme spread, outside-to-outside group measurements offer data only on 2 points of the 3,5,10,20, 50 you shoot. What offers better results in quantifying the dispersion is average radius (mean radius).
If I dare interject, as I don't consider myself an "expert" on this stuff. But, I definitely qualify as a geek.
OK... so, I took a blank target bullseye image and plugged it into my OnTarget computer app. Then I simply "shot" the target 10 times with the app. Each time I started with the same two shots to establish identical Extreme Spread for the group. Then I filled in the other 8 shots, but with different patterns. So, the traditional MOA measurement is exactly the same for each group.
Each pattern of shots is admittedly exaggerated to demonstrate the concept of why Mean Radius is a more meaningful calculation than the standard MOA. That's not to suggest the traditional MOA measurement is without value. But, if you're really trying to figure out the best ammo load... or whether an equipment modification / upgrade is helping, understanding Mean Radius vs traditional MOA may help.
Here we go... The same first two shots (at 3:00 and 9:00) were made to establish the same Extreme Spread for each target... 3 inches (at 100 yards). So, the standard MOA calculation is the same for each target... about 3-MOA.
First target - a somewhat "even" distribution of shots.
Traditional MOA is 3-MOA. Mean Radius is 0.949-inches / 0.906-MOA
Second target - 8 shots are a bit more concentrated.
Traditional MOA is 3-MOA. Mean Radius is 0.743-inches / 0.709-MOA
Third target - a much more concentrated distribution of the remaining 8 shots.
Traditional MOA is 3-MOA. Mean Radius is 0.600-inches / 0.573-MOA
Now, I get that even to the casual observer, it should be obvious that the 3rd target is a better result than the first target despite the traditional MOA measurement being 3-MOA for both. Again, these three examples were intentionally exaggerated to make the point. But, real targets with multiple-shot-groups may be more difficult to discern with casual observation. Using an app like this quantifies the groups so we don't have to depend on "eyeballing" it to try to figure out which one is better.
But, if we are using traditionally-measured MOA (including all the shots) to evaluate various ammo loads (or other equipment changes), we may not be using the best data nor getting a true picture of the results.
The easy way is to discard the "flyers" and measure the remaining tighter group and convert to MOA. But, are they really "flyers?" And dare you face the consternation of your fellow shooters for discarding those flyers?!?

When it comes to determining the best ammo load, using the Mean Radius while including all your shots (over multiple groups) may be a more statistically valid analysis.
Did I get it right, Ledzep??
Last edited:


